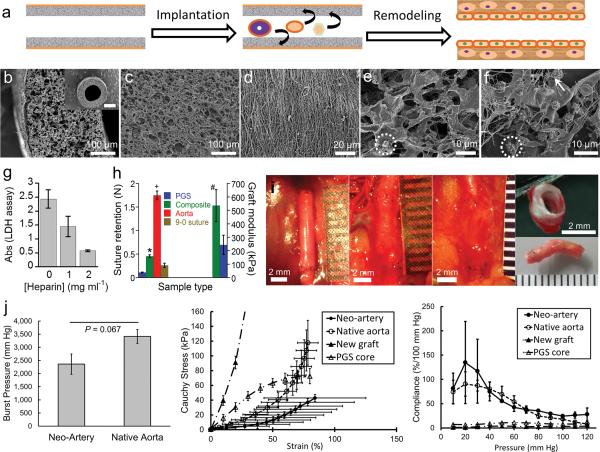
Figure 1.
Characterization of the composite graft and host remodeling of the graft in vivo. (a) Schematic representation of direct implantation of the cell-free graft and the proposed remodeling process of the graft into a biological neo-artery. (b) SEM images of composite grafts to show surface topology, scale bar 100 μm. Inset: top view of the graft, scale bar 500 μm. (c) Lumen of the PGS tube, scale bar 100 μm. (d) The PCL fibrous sheath, scale bar 20 μm. (e) SEM of heparin soaked PGS after incubation in platelet rich plasma to show platelet adhesion and fibrin deposition. Scale bar 10μm. (f) SEM of unheparinized PGS after incubation in platelet rich plasma, scale bar 10 μm. An adherent platelet is circled in e and f to highlight difference in platelet morphology. Arrow indicates fibrin in (f). (g) Platelet adhesion on PGS presoaked in varying heparin concentrations, quantified by lactate dehydrogenase assay (n = 5). P < 0.0001 between all groups. (h) Suture retention and elastic moduli of grafts. Break force of 9–0 suture indicated by &. P < 0.05: * composite graft vs. 9–0 suture,+ composite graft vs. rat aorta, # composite graft modulus (n = 8) vs. that of PGS (grafts without the PCL sheath, n = 3). n = 5 for other groups. (i) Gross appearance of the graft during host remodeling to assess integration with host tissue. From left to right: day 0, day 14, day 90, and day 90 (top and bottom). Scale bars 2 mm, all ruler ticks 1 mm. Non-degradable sutures (black) mark the graft location. (j) Mechanical properties of neo-arteries. Left: The burst pressure of the neo-artery (n = 3) is statistically the same as native aorta (n = 4). Middle: Stress-strain curves of arteries and new grafts. “New grafts” represents unimplanted composite grafts. “PGS core” represents new grafts without the PCL sheath. Right: Compliance of arteries and new grafts. Standard errors for new grafts and the PGS core are very small and barely visible at the plotted scale. For j, n = 3 for neo-arteries and n = 4 for native aortas, new grafts, and PGS cores. Data represent mean ± standard deviation for e–g and mean ± standard error for j.

