Figure 3.
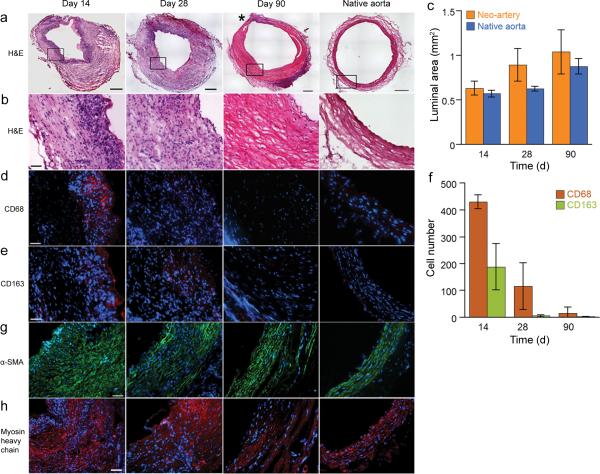
Remodeling of grafts. (a) H&E staining of the grafts during the transition into a neo-artery. An area of the neo-artery wall containing inflammatory cells is marked by (*). The top of the 14-day sample was trimmed to remove the adjoining vein. Image merged from a panel of 100 μ micrographs, scale bar 250 μm. (b) Magnified view of the vessel wall shows ECM content and alignment, scale bar 50 μm. (c) Luminal area of remodeling grafts to assess stenosis and aneurysm formation. There is no statistical difference between the two groups. (d) Changes in number and organization of macrophages (CD68, red). (e) Distribution of M2 macrophages (CD163, red). (f) Number of CD68 and CD163 positive cells quantifies total macrophage number and the proportion of M2 macrophages. (g) Changes of smooth muscle cell (α-SMA, green) organization over time. (h) Distribution of contractile smooth muscle cells (myosin heavy chain, red). All the immuofluorescent micrographs were counterstained for nuclei by DAPI (blue), scale bar 50 μm. Data represent mean ± standard deviation for c and f.

