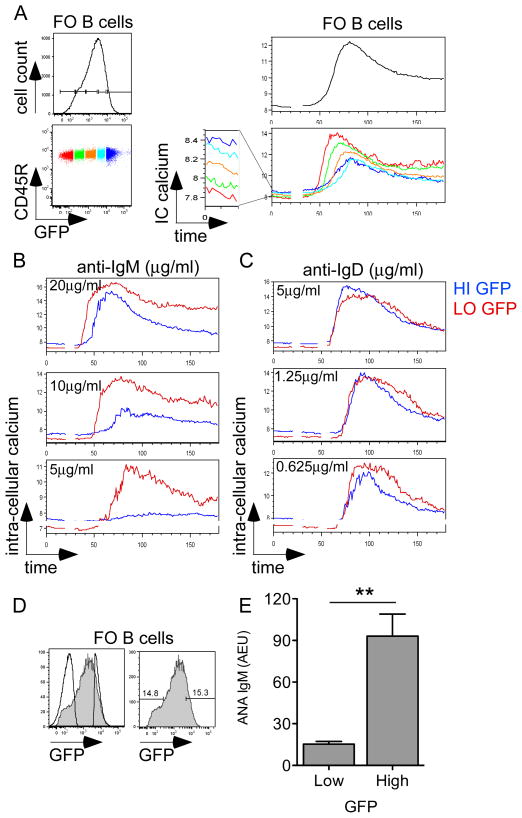
Figure 4. GFP expression predicts functional responsiveness and autoreactivity of B cells.
(A) Left: GFPHI Tg FO (CD23+AA4.1-) splenic B cells were subdivided into color-coded bins on the basis of GFP expression. Right: GFPHI Tg splenic B cells were loaded with Indo-1 dye and stimulated with 10μg/ml anti-IgM. Ratio-metric assessment of intra-cellular calcium was carried out by flow cytometry. Upper right panel represents calcium entry in total FO splenic B cells. Lower right panel represents basal and inducible intra-cellular calcium in GFP-specific bins.
(B, C) Intra-cellular calcium entry was assessed in GFPHI Tg FO splenic B cells upon anti-IgM (B) or anti-IgD (C) stimulation at varying doses. High and low GFP-expressing gates are overlaid.
Data in 4A-C are representative of at least three independent experiments.
(D) Overlaid histograms represent pre- and post-sort follicular mature CD23+ AA4.1- B cells as gated in S9. 15% lowest and highest GFP fractions from the follicular mature B cell compartment were selected for sorting.
(E) High and low-expressing GFP B cells sorted as described in S9A, 4C were stimulated in vitro with LPS for 4 days. Supernatants were subjected to ANA IgM ELISA and total IgM ELISA. Graph represents quantification of ANA IgM normalized to total IgM from 4 independent sorting experiments +/− SEM. Significance was assessed via unpaired t-test. ** = p<0.005

