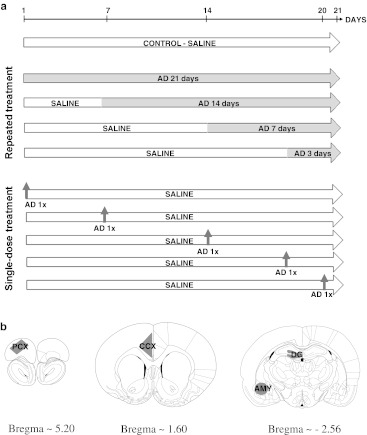
Fig. 1.
(a) A schema of the experimental procedures used. The experiments lasted for a total of 21 days. The control groups received saline for 21 days. The repeatedly treated groups were treated either with DMI or CIT for 21, 14, 7, or 3 days. The single-dose treatment groups received drugs only once during the experiments at the same time points (21, 14, 7, and 3 days and one additional day before the end of the experiment), followed by a drug-free period of time and saline injections. (b) Drawings of the coronal diagrams adapted from the rat brain atlas (Paxinos and Watson 1998) and the microdissected brain regions in which gene expression was studied, i.e., the prefrontal cortex (PCX), the cingulate cortex (CCX), the dentate gyrus of the hippocampus (HIP), the basolateral nuclei of the amygdala (AMY)

