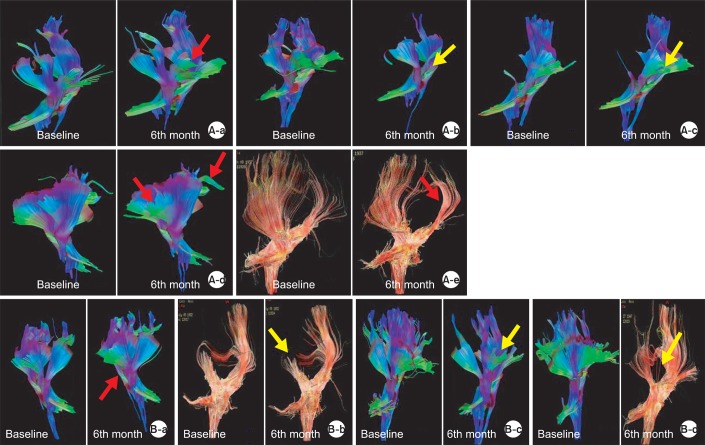
Fig. 5.
Changes in DTT of GH group and control group. (A-a) DTT change in A1 patient; increased fibers in bilateral frontal areas at 6 months compared to the baseline study. (A-b) DTT change in A2 patient; decreased fibers in bilateral frontal areas at 6 months, compared to the baseline study. (A-c) DTT change in A3 patient; decreased fibers in the left frontal areas at 6 months compared to the baseline study. (A-d) DTT change in A4 patient; increased fibers in the left frontal and posterior parietal areas at 6 months compared to the baseline study. (A-e) DTT change in A5 patient; mild increased fibers in the left parietal areas at 6 months compared to the baseline study. (B-a) DTT change in B1 patient; mild increased fibers in the left frontal and parietal areas at 6 months compared to the baseline study. (B-b) DTT change in B4 patient; mild decreased fibers in the right parietal areas and corpus callosum at 4 months compared to the baseline study. (B-c) DTT change in B6 patient; obvious decreased fibers in the right frontal areas at 4 months compared to the baseline study. (B-d) DTT change in B9 patient; obvious decreased fibers in the right frontal and parietal areas at 1 year compared to the baseline study. Red arrows: increased fibers, yellow arrow: decreased fibers.

