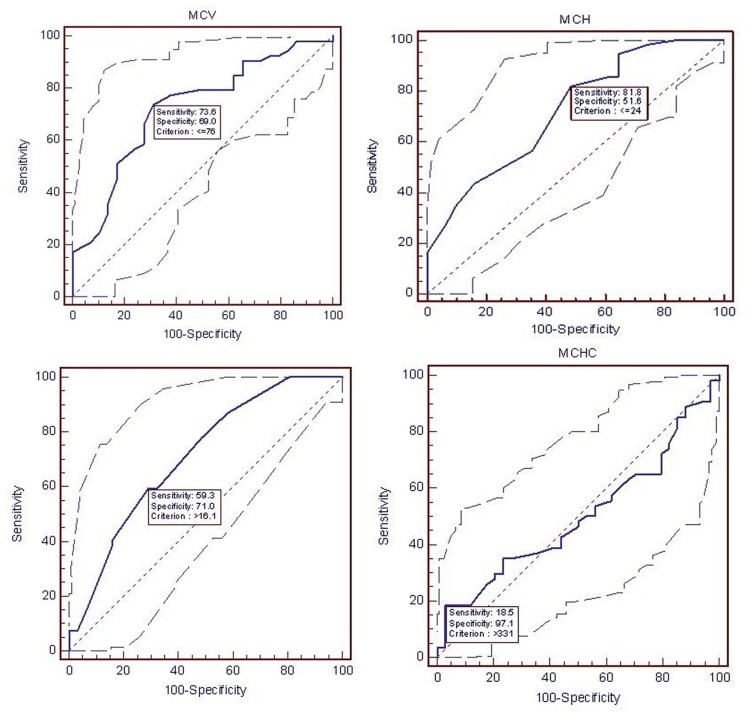
Fig. 1.
(A) Area under the ROC curve (AUC)=0.724 (95 % CI=0.614 – 0.817, p-value=0.0003 and +LR 2.37), (B) Area under the ROC curve (AUC)=0.721 (95 % CI=0.614 – 0.812, p-value=0.0002 and +LR 1.69), (C) Area under the ROC curve (AUC)=0.711 (95 % CI=0.602 – 0.804, p-value=0.0002 and +LR 2.04), (D) Area under the ROC curve (AUC)=0.500 (95 % CI=0.391 – 0.609, p-value=1.0 and +LR 6.3).

