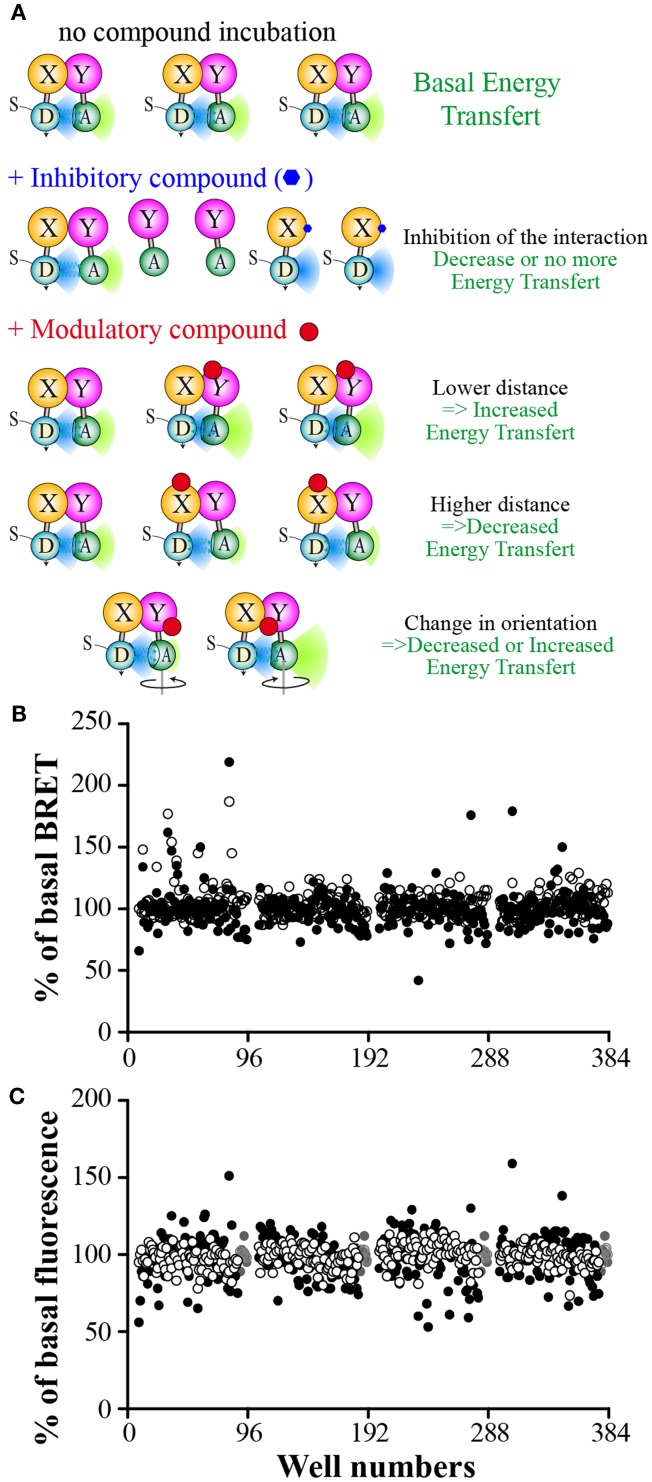
Figure 4.
Expected results from a P2I2 BRET-based screening assay. (A) Different expected BRET change upon inhibitor or modulator compound action compared to basal BRET signal. X and Y: Protein X and Y; D: energy donor; A: energy Acceptor; S: BRET Substrate. (B) Results of a 320 compounds miniscreen using OBRc/OBRGRP (●) and CD4/PLSCR1 (○) BRET-based screening assays, expressed as% of basal BRET in absence of compound in each plate. (C) Fluorescence measured from the same plates as in (B) expressed as % of fluorescence value in absence of compound (represented by  ).
).

