Figure 6.
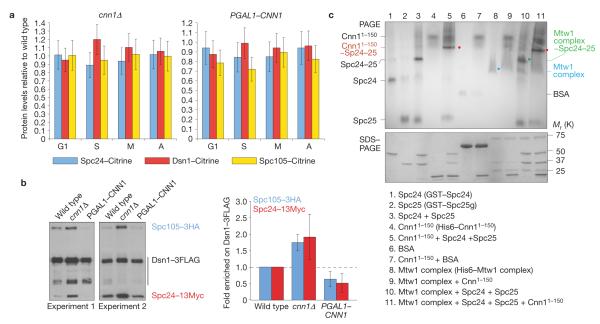
Cnn1 inhibits the interaction between the KMN complexes. (a) Cnn1 does not recruit KMN complexes to centromeres. Endogenously expressed Dsn1–Citrine, Spc24–Citrine and Spc105–Citrine were quantified by spinning-disc confocal fluorescence imaging in asynchronous cultures of wild-type, cnn1Δ and PGAL1–CNN1 strains (2% galactose minimal medium, 23 °C). Cell-cycle stages are indicated; G1, S phase, metaphase (M) and anaphase (A). Fluorescence levels were normalized to those measured in the wild-type strain (value = 1.0). Spc110–mCherry acted as the internal reference. For each measurement, 50 kinetochores were analysed (n = 50). The error bars represent s.d. (b) Cnn1 inhibits the binding between the Mtw1, Spc105 and Ndc80 complexes. Spc105–3HA and Spc24–13Myc co-purifying with Dsn1–3FLAG from wild-type, cnn1Δ and PGAL1–CNN1 stains (2% galactose YP medium, 23 °C) were identified by anti-FLAG, anti-HA and anti-Myc western hybridization (left panels). The levels of Spc105–3HA and Spc24–13Myc co-purifying with Dsn1–3FLAG were quantified (ImageJ 1.43u) and normalized to those of Dsn1–3FLAG (right plot). The error bars represent s.d. (c) Cnn11–150 prevents the Mtw1 complex (Dsn1, Mtw1, Nsl1 and Nnf1) from binding to the Spc24–Spc25 dimer. Epitope-tagged recombinant proteins were incubated in various combinations as indicated in the rectangle (Spc25g, global domain of Spc25; residues 128–222). The single proteins and reaction mixtures were analysed by non-denaturing PAGE to visualize the relative positions of input proteins and formed complexes (indicated), and by denaturing SDS–PAGE to confirm protein purity and concentrations. Proteins were visualized with Gelcode blue. BSA, bovine serum albumin. Uncropped images of blots and gels are shown in Supplementary Fig. S7.

