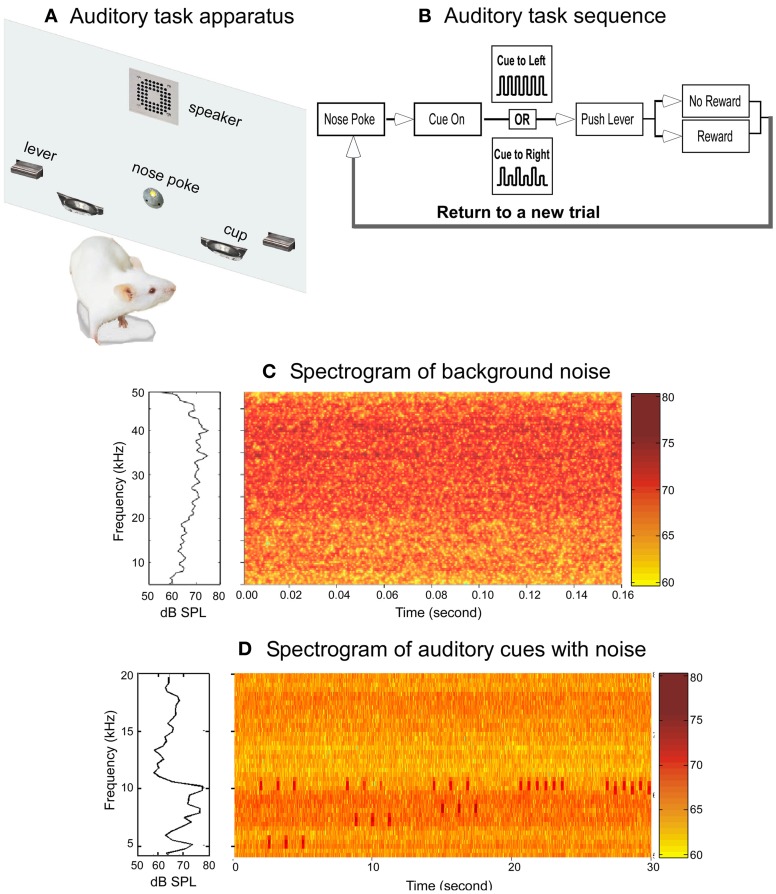
Figure 1.
The auditory behavioral task and the acoustic environments. (A) Schematic drawing of the behavioral training chamber panel holding the operant devices. (B) Block diagram showing the auditory task sequence. (C) Spectrum (left panel) and spectrogram (right panel) of the noise to which the rats were exposed. The data represent the averaged measurements from the center of six cages. (D) Spectrum (left panel) and spectrogram (right panel) of the auditory cues and the noise background. To display the auditory cues clearly, only frequency range of 4–20 kHz was plotted.

