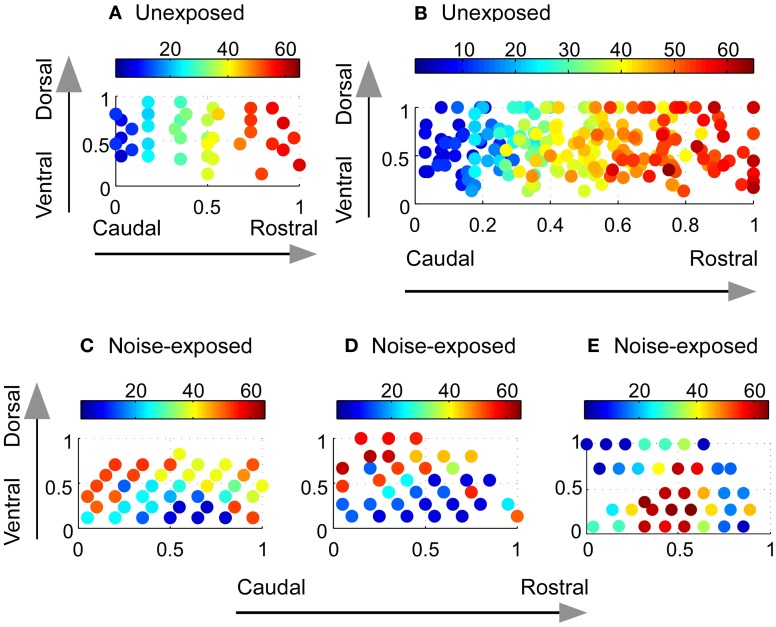
Figure 2.
Reorganization of the tonotopic map in the A1 of adult rats chronically exposed to low-level noise. (A–B) Tonotopic map in the A1 of an unexposed rat (A) and compound frequency representation in the A1 of all unexposed rats (B). (C–E) Examples of reorganized frequency representation in three noise-exposed rats. The color bar indicates the value of sound frequencies. The x- and y-axes represent normalized caudal—rostral and ventral—dorsal dimension, respectively, of the primary auditory cortex (see “Materials and Methods”).

