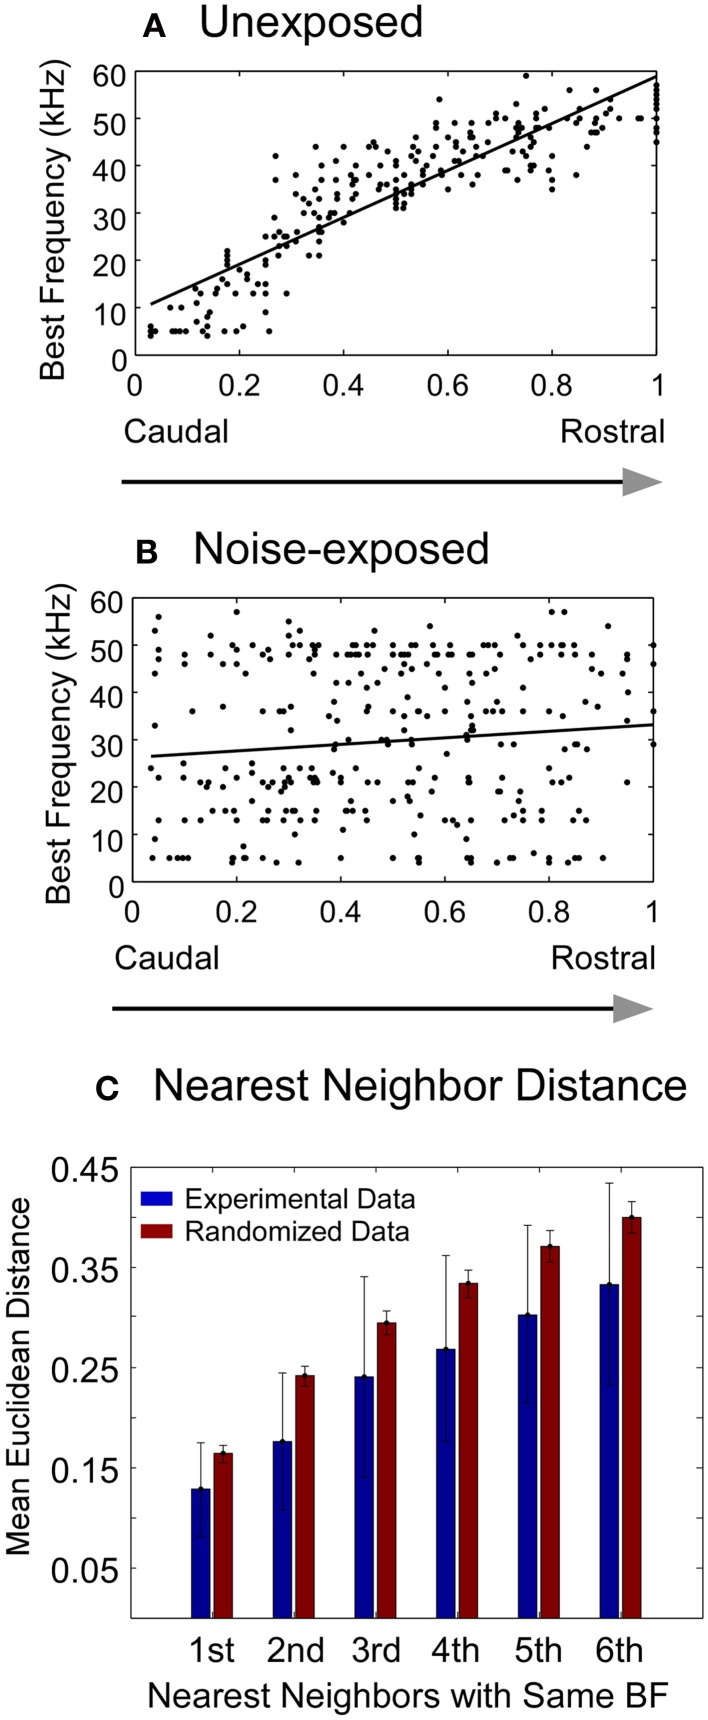
Figure 3.
Changes in best frequency representation in the A1 of adult rats chronically exposed to low-level noise. (A–B) Best frequency representation along the caudal-rostral axis of the A1 in unexposed (A) and noise-exposed (B) rats. The x- and y- axes represent normalized caudal—rostral and ventral—dorsal dimension, respectively, of the primary auditory cortex (see “Materials and Methods”). (C) Comparison of the mean Euclidean distance of the recorded sites with the same best frequency between the experimental data from the noise-exposed rats (blue bars) and the randomized data (red bars) (see “Materials and Methods”). Vertical bar: mean ±1 SD. All the pairs of bars are significantly different from each other (Mann–Whitney Rank Sum Test, P < 0.001).

