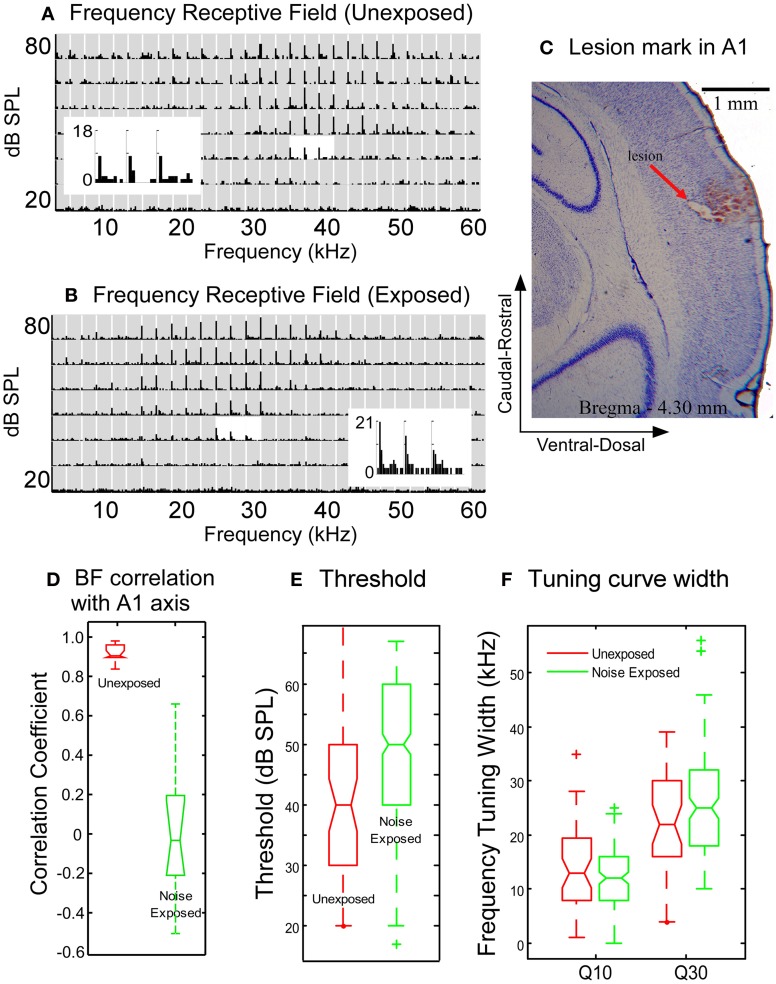
Figure 4.
Comparison of neuronal response properties between the untrained, unexposed and the noise-exposed rats. (A–B) Examples of frequency receptive fields recorded from the A1 of an unexposed (A) and a noise-exposed rat (B). Gray rectangles in the plots of receptive field: post-stimulus histogram (PSTH) of neuronal responses to each combination of frequency/intensity (bin with: 10 ms, duration: 750 ms). The PSTHs around the best frequency at the threshold level were enlarged to show the details of neuronal responses. (C) Nissl stain showing the lesion mark of recording site in a noise-exposed rat. (D) Box plot comparison of the correlation coefficients of best frequency distribution along the caudal-rostral axis of the A1. (E) The tone response threshold in noise-exposed rats increased moderately as compared with the unexposed rats. (F) The width of frequency tuning curves measured at Q10 and Q30 in the noise-exposed rats remained the same as that in the untrained, unexposed rats. In the box plot in D–F, the upper and lower lines of the notched box represent the 25th and 75th percentiles of the data and the middle line indicates the median. The horizontal lines above and below the notched box represent the range of the data sample. Outliers, defined as more than 1.5 times the inter-quartile range (the length of the box) away from the top or bottom of the box, were plotted with symbols “+”. No-overlapping notches between the two data sets indicate significant difference in medians with 95% confidence.

