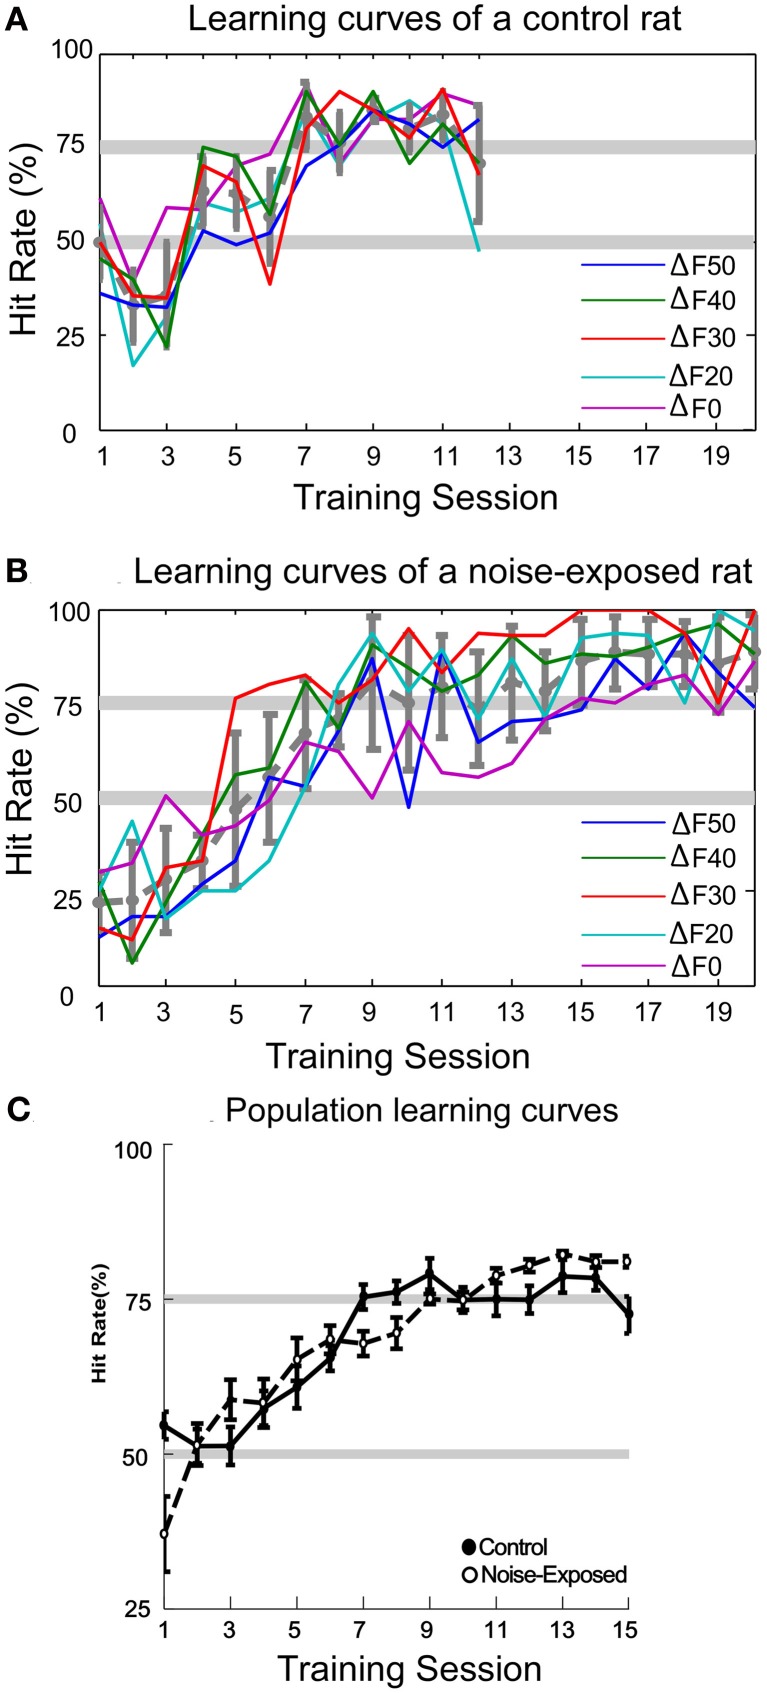
Figure 5.
Auditory task learning curves. (A–B) Learning curves for a control and a noise-exposed rat, respectively. Each colored line represents the learning progress for recognizing each sound pattern, indicated by the percent frequency change (ΔF = (low – high)/high frequency; ΔF0 represents the constant sound pattern). Both control and noise-exposed rats learned to recognize all patterns of tone trains concurrently. The average hit rate across all sound patterns in each session is shown by the dashed-gray line (error bars: mean ±1SD). (C) Population learning curves of control and noise-exposed rats. No significant difference in hit rate was found in all sessions between the control and noise-exposed rats (error bars: mean ±1 SEM).

