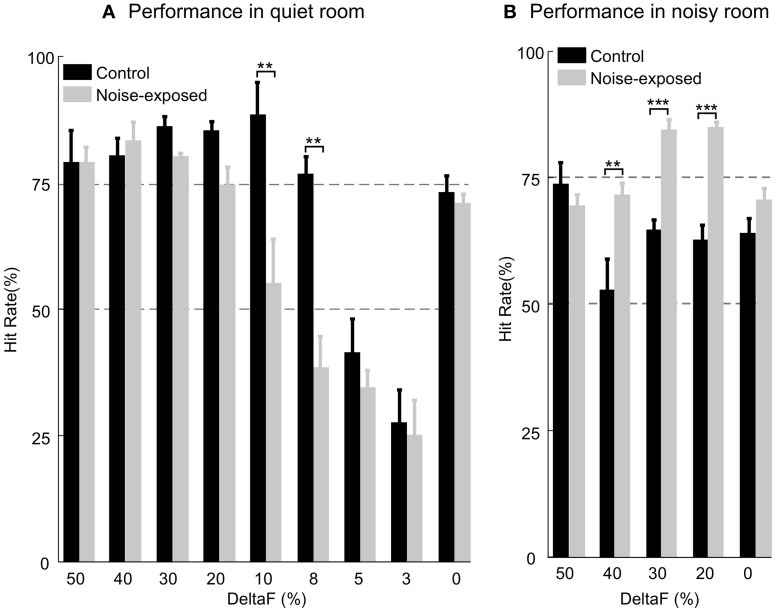
Figure 6.
Comparison of auditory task performance in a quiet (A) and a noisy room (B). In a quiet room, the noise-exposed performed significantly worse than the control rats only at the ΔF = 10% and 8%. In a noisy room, the noise-exposed rats performed significantly better than the control rats at the most of ΔFs (40%, 30%, and 20%) tested. Error bars: mean ±1 SEM. Number of asterisks indicates the level of significance of Mann–Whitney Rank Sum Test: **, P < 0.01; ***, P < 0.001.

