
Figure 3. Laser intensity controlled dynamics of plasmon-driven chemical reactions.
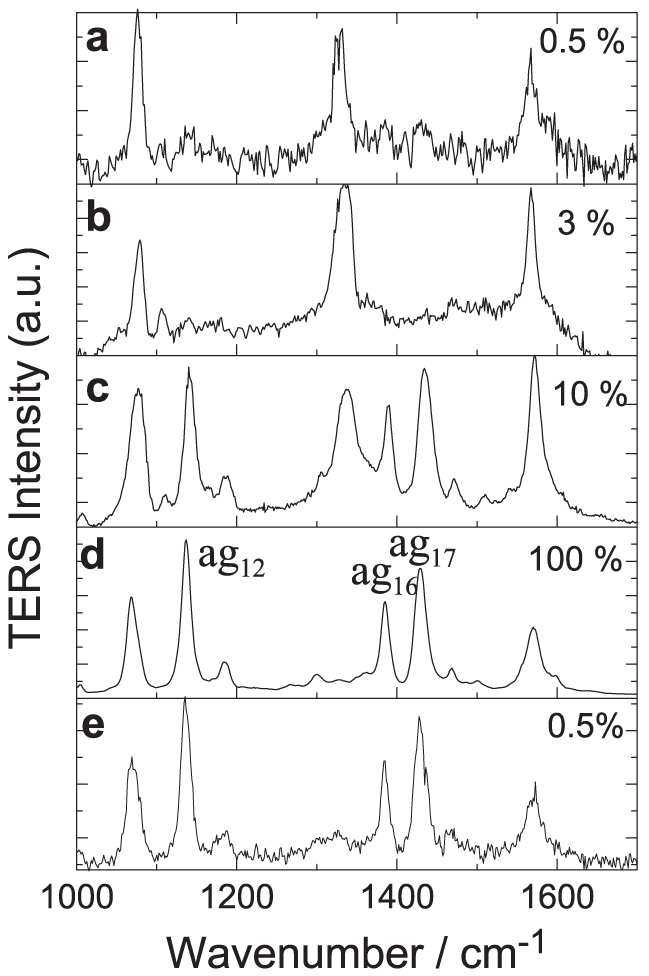
Laser power at (a) 0.5%, (b) 3%, (c) 10%, (d) 100% and (e) 0.5% at bias voltage 1 V, and current 1 nA. The vibrational modes of ag12, ag16 and ag17 for DMAB were assigned in (d).