Figure 4.
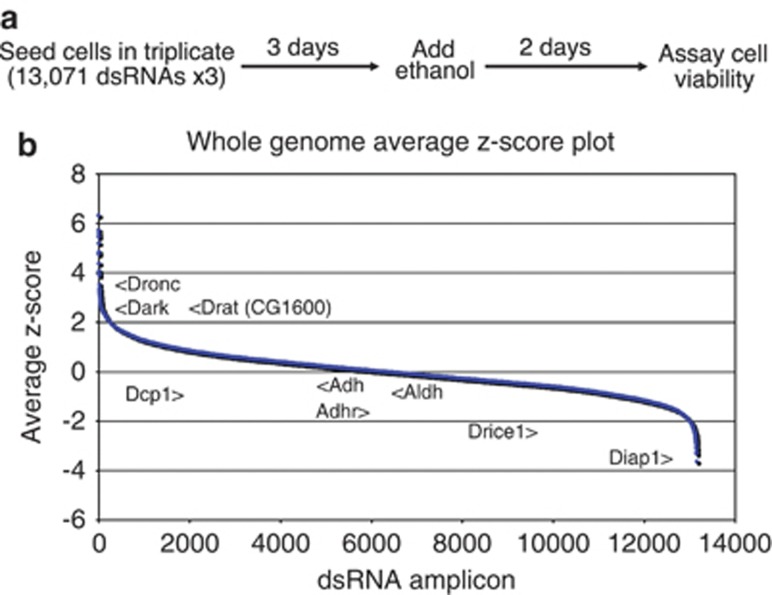
A genome-wide screen captures effectors of ethanol-induced cell death. (a) Schematic for the screen protocol. See Materials and Methods for details and statistical analyses. Note that each dsRNA was scored in triplicate ( × 3). (b) Average position mean-centered z-scores for the genome-wide screen are plotted in rank format. Arrowheads indicate ‘landmark' apoptotic genes and the alcohol-metabolizing enzymes Adh/Adhr and Aldh

