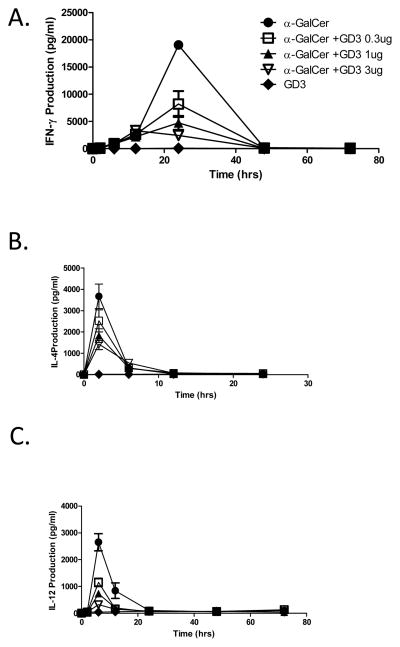
Figure 4. GD3 inhibits α-GalCer-induced cytokine production in vivo.
(A) WT C57BL/6 mice were treated intravenously with 1 μg of either α-GalCer in the presence or absence of the indicated concentrations of GD3, and serum samples were obtained at the indicated time points after injection for ELISA analyses of IFN-γ, (B) IL-4, and (C) IL-12 concentrations. The data are expressed as the mean ± SD of two different dilutions of pooled sera. In all figures, the data represent one of two or more experiments with similar results.

