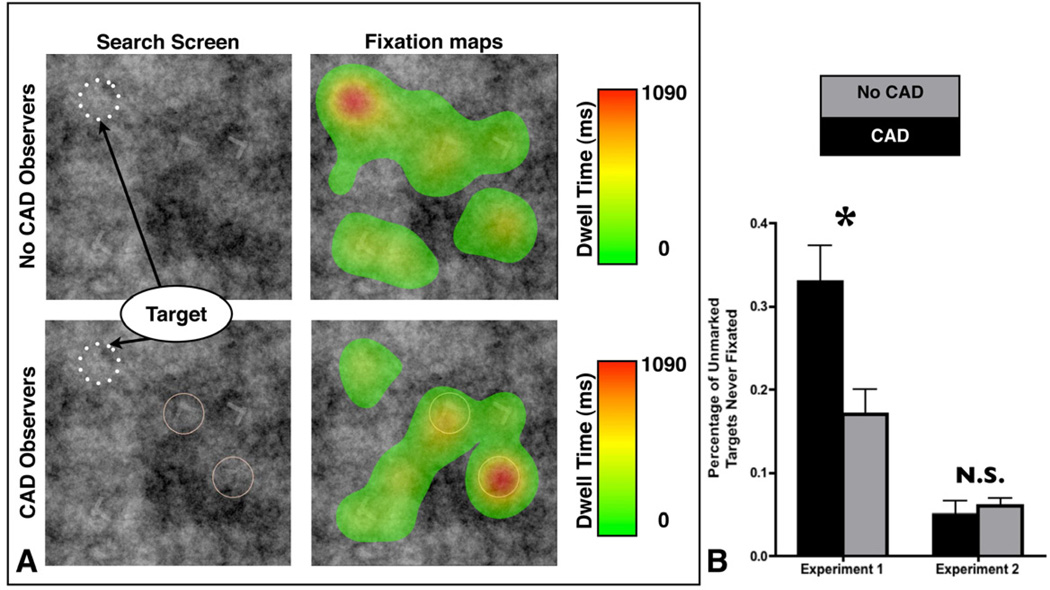
Figure 3.
A: Heat maps for a target present trial where the CAD system did not mark the target. Search array and heat maps for the No CAD observers and CAD observers respectively. Color indicates the amount of time spent on a particular region of space. Note that the scale for these heat maps is the same. B: Percentage of unmarked targets that were never fixated in Experiment 1 and 2. Star denotes a significant difference between the percentage of targets missed in the CAD and No CAD block during Experiment 1.

