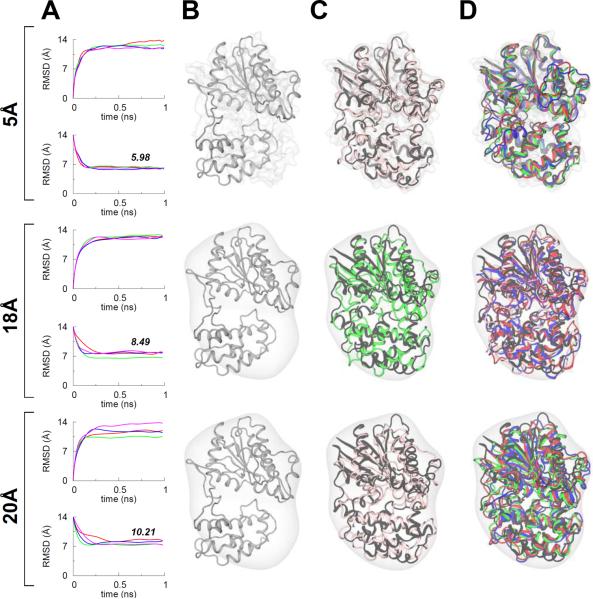
Figure 3. Post-TAMD MDFF Fittings of the Gα-Subunit.
(A) RMSD traces from four independent MDFF simulations of the TAMD-generated conformation of Gα for three different target map resolutions. As in Figure 1, the top and bottom panels for each map resolution show the Cα-RMSD traces from the known initial and final crystal conformations of Gα. The numbers in italics on bottom RMSD panels represent the final average (of four MDFF runs) RMSD with respect to the known target crystal structure (B) Cartoon representation of the TAMD-generated conformation of Gα is shown docked in the target maps at three different resolutions. (C) For each map, overlay of MDFF-generated conformations with highest correlation-coefficients (among four independent runs) and the closed-state target crystal structure (black cartoons) of Gα. MDFF-generated conformations are in the same color as RMSD traces in panel A. (D) For three additional MDFF runs, overlay of MDFF-generated conformations and the target crystal structure. See also Table S2 for correlation-coefficients.
Vashisth, Skiniotis, and Brooks, 2012

