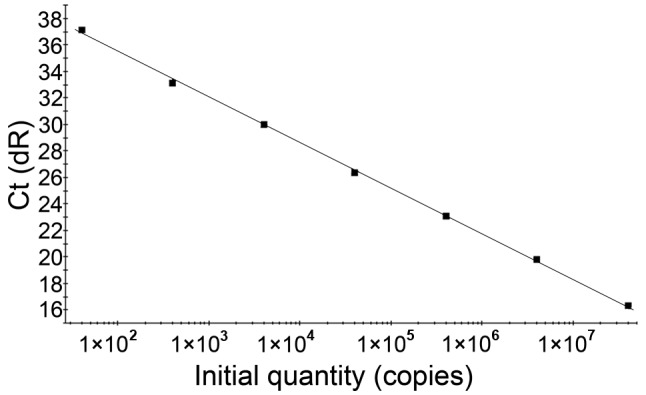
Figure 2.

Standard curve of HBV DNA obtained using the LNA real-time PCR probe. The data show a positive correlation in the region of 40 to 4.0x10⁷ IU/ml. The equation is Y=−3.425 log (X) + 45.72, with a correlation co-efficient of 0.999. HBV, hepatitis B virus; PCR, polymerase chain reaction; LNA, locked nucleic acid; dR, double ratio; Ct, threshold cycle.
