
Figure 4.
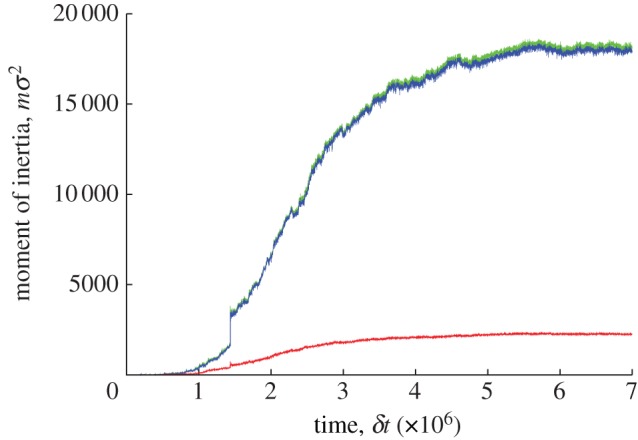
Time lines of the principal moments of inertia of the largest cluster in the T = 1.7 quench (largest eigenvalue Il, green; middle eigenvalue Im, blue; smallest eigenvalue Is, red).
Official websites use .gov
A
.gov website belongs to an official
government organization in the United States.
Secure .gov websites use HTTPS
A lock (
) or https:// means you've safely
connected to the .gov website. Share sensitive
information only on official, secure websites.
Time lines of the principal moments of inertia of the largest cluster in the T = 1.7 quench (largest eigenvalue Il, green; middle eigenvalue Im, blue; smallest eigenvalue Is, red).