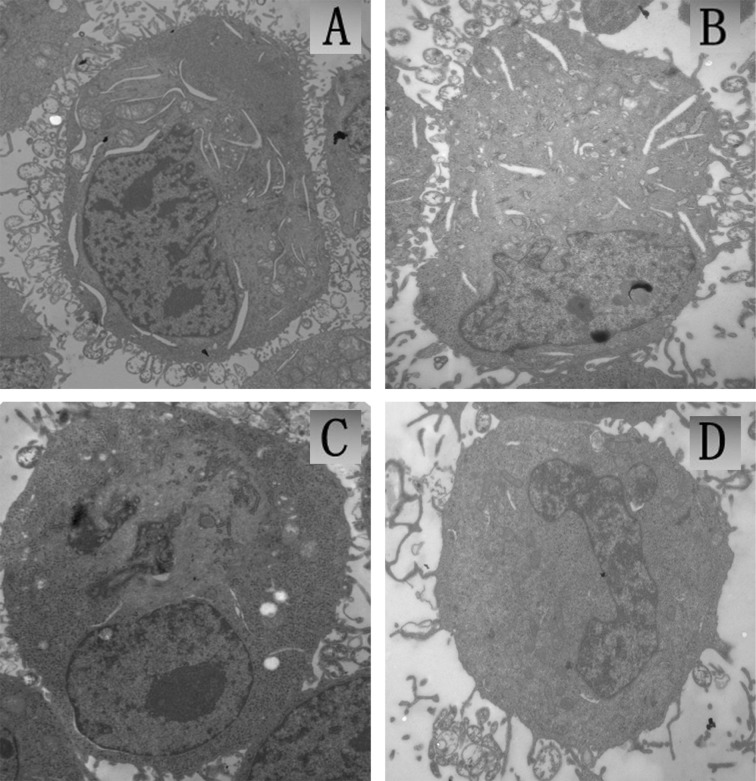
Figure 5.
TEM images of U251 cells in vitro (x10,000). (A) Control group with untreated intact cells, (B) cells with 5.0 μg/ml ZnPcS2P2 alone, (C) cells irradiated with US alone, (D) cells irradiated with US in the presence of 5.0 μg/ml ZnPcS2P2. TEM, transmission electron microscopy; US, ultrasound.

