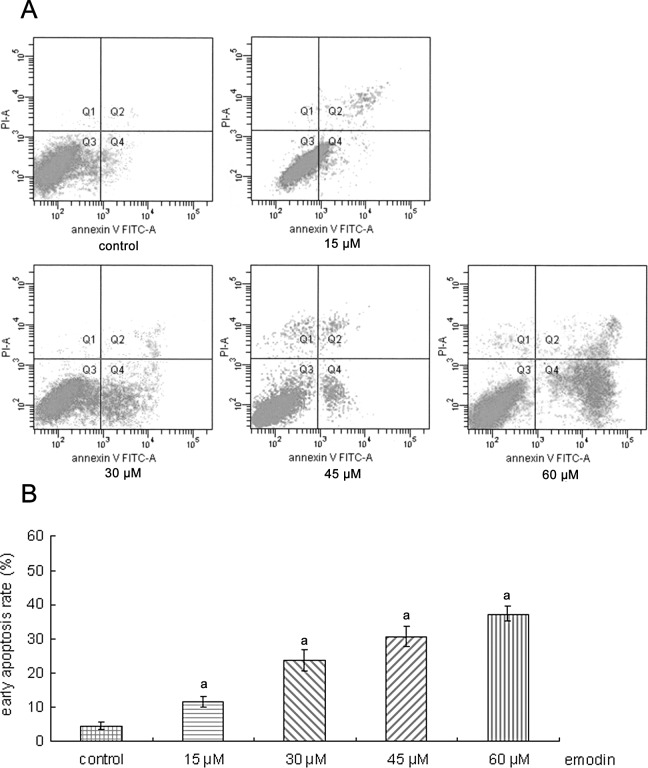
Figure 2.
Apoptosis induced by emodin in SGC-7901 cells. (A) SGC-7901 cells were treated with 15, 30, 45 and 60 μM emodin for 24 h. Cells were then collected and stained with FITC-Annexin V/PI to detect cell death phenomena. The y-axis indicates PI-labeled population and the x-axis indicates FITC-labeled Annexin V-positive cells. Cells in the lower right area indicate apoptotic cells. One representative experiment out of three is shown. (B) Apoptotic rates of SGC-7901 cells induced by emodin. aP<0.01 compared to the control.

