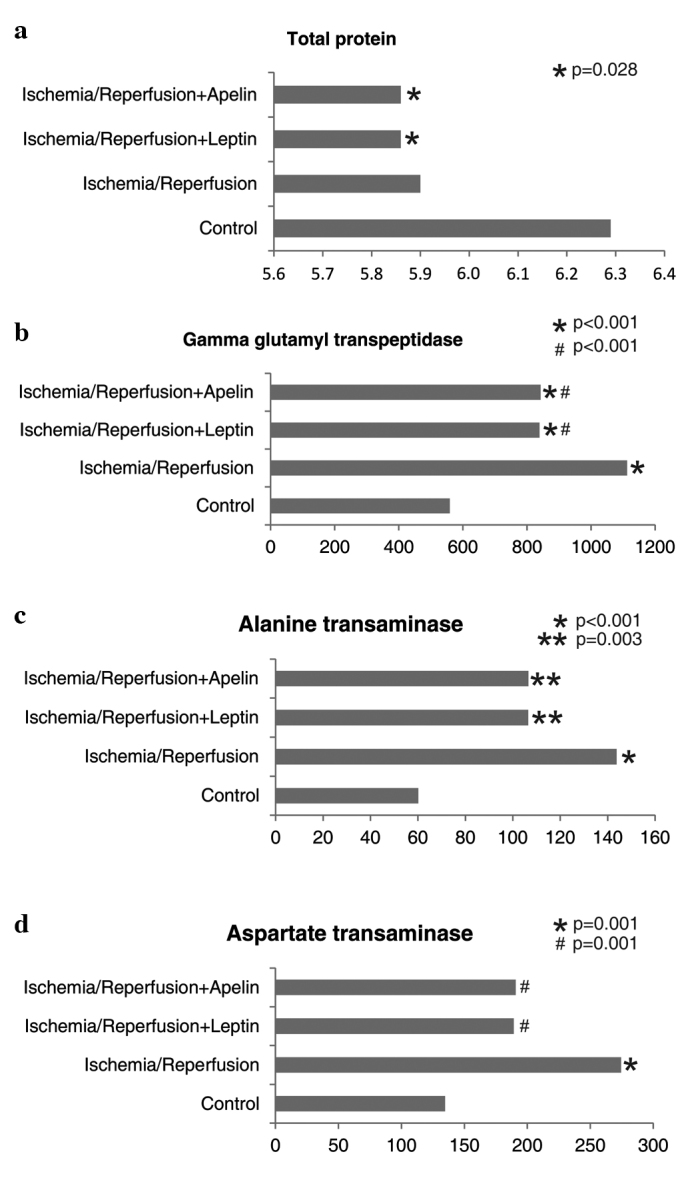
Figure 3.

Comparison of the study groups in terms of (a) total protein, (b) γ-glutamyl transpeptidase, (c) alanine transaminase and (d) aspartate transaminase levels. *,**Different from the control group, #Different from the ischemia/reperfusion group.
