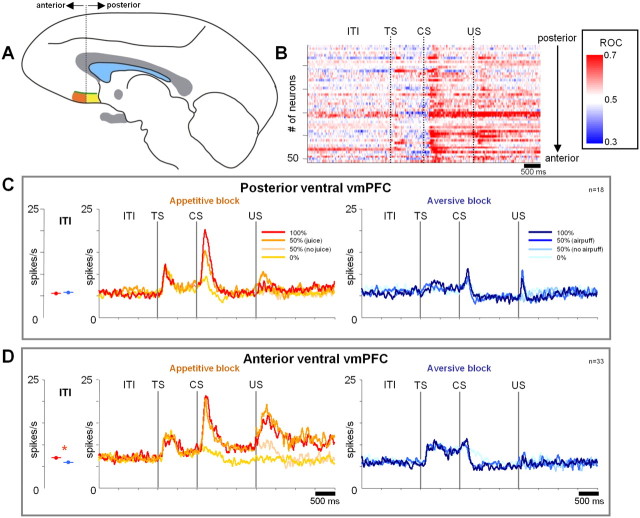
Figure 10.
Subregional organization within the ventral vmPFC. A, The regions of recording within the posterior (yellow) and anterior (orange) region of the ventral vmPFC. Posterior region, 7–11 mm from AC; anterior region, 12–15 mm from AC. B, Within-trial changes in the appetitive/aversive differential coding shown for individual vmPFC neurons. Each line indicates the data from a single neuron. The magnitudes of the differential encoding are expressed as ROC areas (derived by a running ROC analysis comparing single trial SDFs in the appetitive and aversive blocks at every millisecond) and are color coded. Neurons are sorted according to their locations along the posterior–anterior axis. Only positive neurons are shown. C, D, Average activity of positive neurons in the posterior region (C) and the anterior region (D) of the ventral vmPFC. The same convention as in Figure 4. Average ITI activity in appetitive (red) and aversive (blue) blocks is shown to the left of the SDFs. An asterisk indicates a significant difference (paired sign-rank test; p < 0.05).

