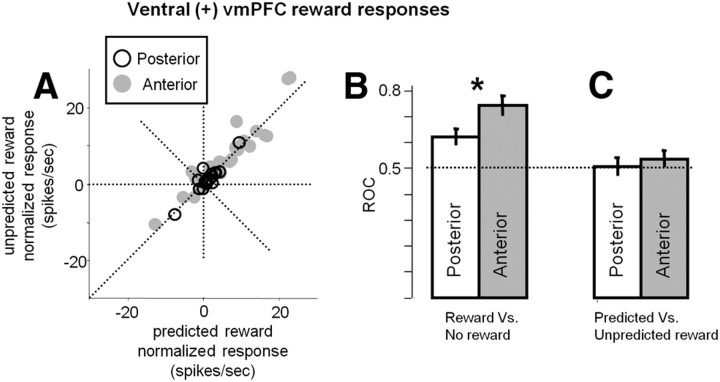
Figure 11.
Comparison of ventral vmPFC responses to predicted and unpredicted reward delivery. A, Each data point indicates the responses of a single ventral vmPFC neuron to the predicted reward US (x-axis) and the unpredicted reward US (y-axis). The data are shown separately for the anterior (gray) and posterior (black) regions in the ventral vmPFC. B, Differential coding of ventral vmPFC neurons between reward delivery (after 100 and 50% reward cues) and reward omission (after 0 or 50% reward cues). The magnitude of the differential encoding was measured by ROC areas. The average ± SEM ROC area is shown separately for the anterior and posterior regions of the ventral vmPFC. Values above 0.5 indicate stronger responses to reward delivery than to reward omission. C, Differential coding of ventral vmPFC neurons between the predicted reward delivery (after 100% reward cues) and the unpredicted reward delivery (after 50% reward cues). Same conventions as in B. Values above 0.5 indicate stronger responses to the unpredicted than predicted reward delivery. Asterisk indicates significant difference in the average ROC area between the posterior and anterior regions of the ventral vmPFC (Wilcoxon's rank-sum test; p < 0.05).

