
Figure 13.
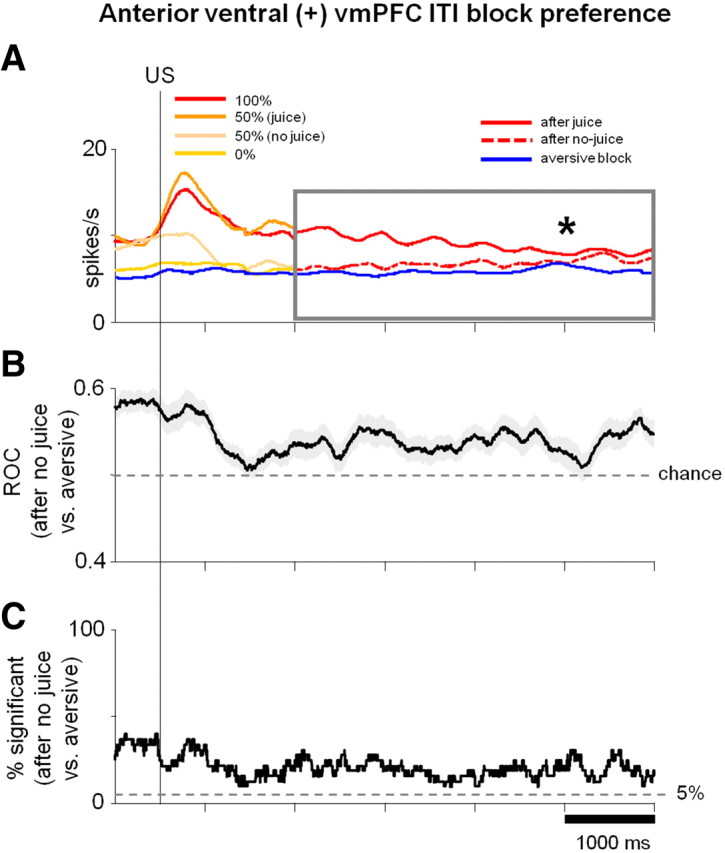
Anterior ventral vmPFC ITI activity is related to valence context. A, SDFs of average activity of positive neurons in the anterior region of ventral vmPFC (σ = 300 ms) aligned on US in the appetitive and aversive blocks. Colors of SDFs in the appetitive block for the first 1.5 s after US are the same as in Figure 10D. Reward delivery and omission responses after 100, 50, and 0% CSs are shown separately. Because these neurons were not strongly modulated by punishment delivery and omission (Fig. 10D; right), all trials in the aversive block are combined (blue SDF). ITI activity after 1.5 s after the US (shown in the gray box) is sorted into three categories: ITI after rewards (solid red line), ITI after no rewards (dotted red line), and ITI during aversive block (blue line). Asterisk indicates significant difference between the level of ITI activity after no-reward trials and aversive block trials (paired sign-rank test; p < 0.01; comparison made for activity in the time window indicated by the gray box). B, Average ± SEM ROC (shaded region). For each neuron, a running ROC analysis (at each millisecond of the SDFs in A) compared ITI activity after no-reward trials in the appetitive block with ITI activity in the aversive block (blue line in A). C, Percentage of neurons in time with significant differences in ITI activity after no-reward trials in the appetitive block versus ITI activity during the aversive block (tested at each millisecond of the SDFs in A; two-tailed rank-sum test; p < 0.05).