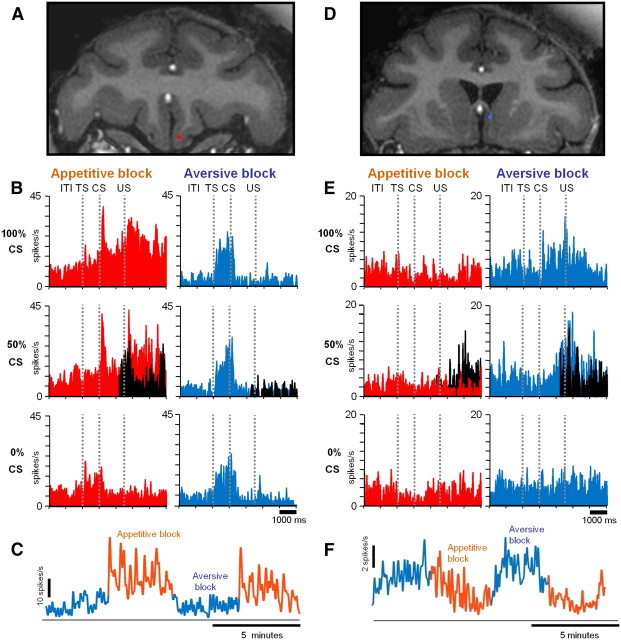
Figure 2.
Two example neurons in the vmPFC. A–C, A neuron that preferred the appetitive block (positive neuron). D–F, A neuron that preferred the aversive block (negative neuron). A, D, Recording sites plotted on coronal MR images (red, positive neuron; blue, negative neuron). B, E, Average spike activity shown separately for different CSs in the appetitive and aversive blocks. Shown in black is the activity in trials when US was omitted. The spike activity is shown by SDFs (σ = 50 ms). C, F, Across-block changes in spike activity (σ = 2000 ms).

