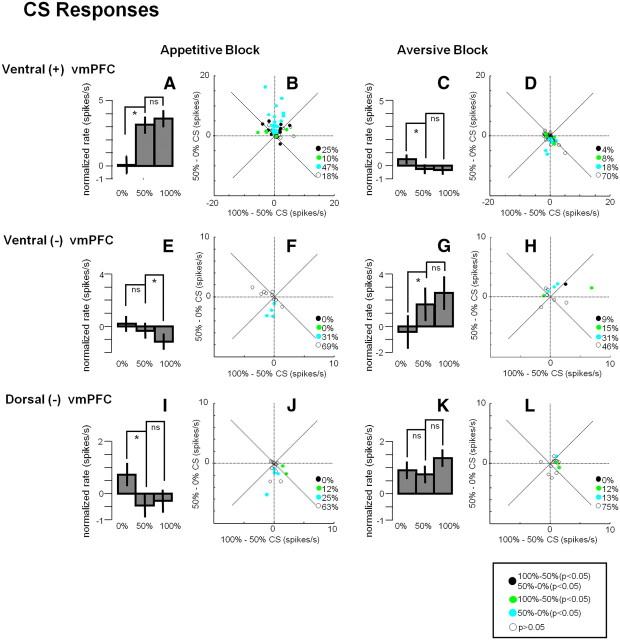
Figure 6.
A–L, CS responses in three groups of vmPFC neurons. Top, Ventral (+); middle, ventral (−); bottom, dorsal (−). Bar graphs show the average ± SEM CS responses in the appetitive block (left) and the aversive block (right). Asterisks indicate significant differences between conditions (paired sign-rank test; p < 0.05); ns indicates not significant. All responses were normalized relative to baseline in each block. Scatter plots show, for individual neurons, the difference between 100–50% CS responses (x-axis) and 50–0% CS responses (y-axis). Filled circles indicate neurons with significant variance (Wilcoxon's rank-sum test; p < 0.05). Black circles, Neurons showing significant differences in CS response in both 100–50% comparison and 50–0% comparison. Green circles, Neurons showing significant differences in only 100–50% comparison. Cyan circles, Neurons showing significant differences in only 50–0% comparison. White circles, neurons showing no significant differences. Percentages of these groups are indicated in each scatter plot.

