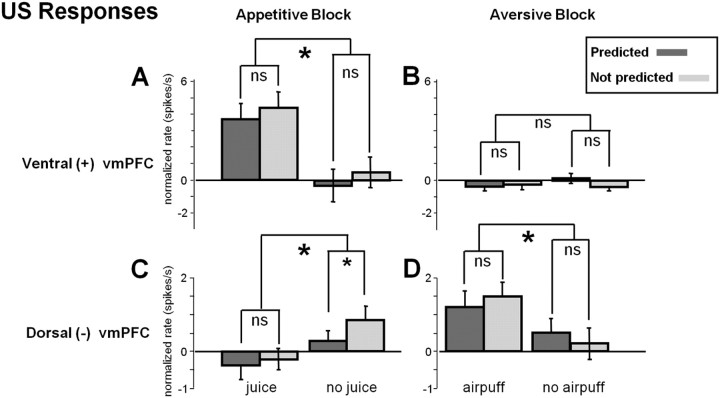
Figure 7.
A–D, US responses in two groups of vmPFC neurons. Top, Ventral (+); bottom, dorsal (−). The average ± SEM US responses are shown for the appetitive block (left) and the aversive block (right). All responses were normalized relative to baseline in each block. Small asterisks indicate a significant difference between predicted and not predicted outcomes; large asterisks indicate significant difference between outcome delivery and omission (paired sign-rank test; p < 0.05); ns indicates not significant.

