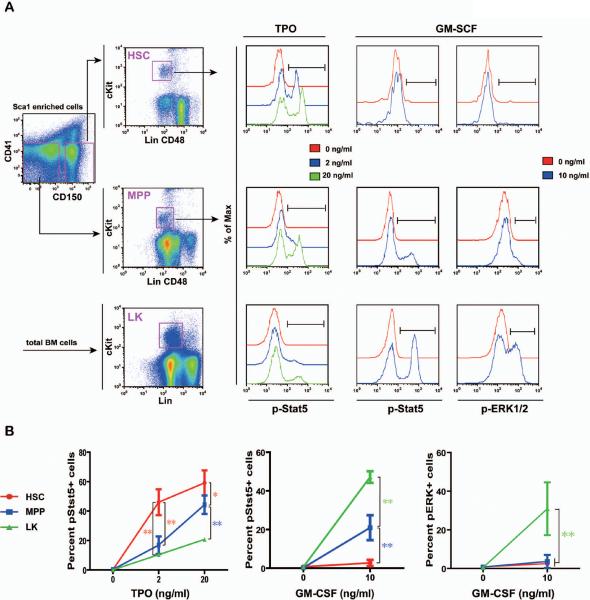
Figure 3. HSCs display a distinct TPO and GM-CSF signaling profile from highly purified MPPs and heterogeneous LK cells.
Total bone marrow cells were freshly isolated from C57BL/6 mice and enriched for Sca1+ cells. CD150+ CD41− cells (enriched for HSCs) and CD150− CD41− cells (enriched for MPPs) were subsequently sorted from Sca1+ enriched cells. Sorted cells were equally divided into a few aliquots, serum- and cytokine-starved for 30 minutes, and stimulated with 2 or 20 ng /ml of TPO or 10 ng/ml of GM-CSF for 10 minutes at 37°C. Levels of phosphorylated ERK1/2 and Stat5 were measured using phospho-specific flow cytometry. HSCs (defined as [Lin CD48]−/low cKit+ cells from sorted CD150+ CD41− cells) and MPPs (defined as [Lin CD48]−/low cKit+ cells from sorted CD150− CD41− cells) were gated for data analysis. LK cells (defined as Lin−/low cKit+ cells) were directly gated and analyzed from nonneutrophilic total bone marrow cells. (A) Representative gating strategy and plots of phosphorylated signaling proteins are shown (n= 4–7). pStat5+ or pERK+ cells are defined on each plot. (B) The percentages of pStat5+ or pERK+ cells are shown as mean + s.d.. Student's t-test was performed: * p<0.05 and ** p<0.01. Note: The Lin cocktail used to define HSCs and MPPs includes Ter119, B220, and Gr1, whereas the Lin cocktail used to define LK cells includes CD3, CD4, CD8, Ter119, B220, and Gr1.

