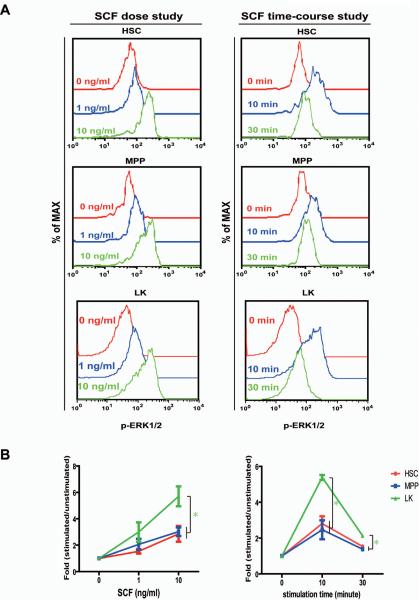
Figure 5. HSCs and MPPs respond to SCF stimulation with a different amplitude and kinetics from LK cells.
The CD150+ CD41− cells and CD150− CD41− cells were simultaneously sorted from Sca1+ enriched bone marrow cells and stimulated with 1 or 10 ng/ml of SCF (dose study), or 10 ng/ml of SCF for 10 or 30 minutes (time-course study) as described in Figure 3. Levels of phosphorylated ERK1/2 (p-ERK1/2) were measured in HSCs, MPPs, and LK cells as described in Figure 3. (A) Representative plots of p-ERK1/2 are shown. (B) To quantify the activation of ERK1/2, median intensities of p-ERK1/2 at different SCF concentrations or stimulated for different periods are compared to their respective control cells at 0 ng/ml or 0 minute, which are arbitrarily set at 1. Quantification of 4–8 independent experiments is shown as mean ± s.d.. Green asterisks indicate significant differences of LK cells compared to HSCs and MPPs (p<0.05).

