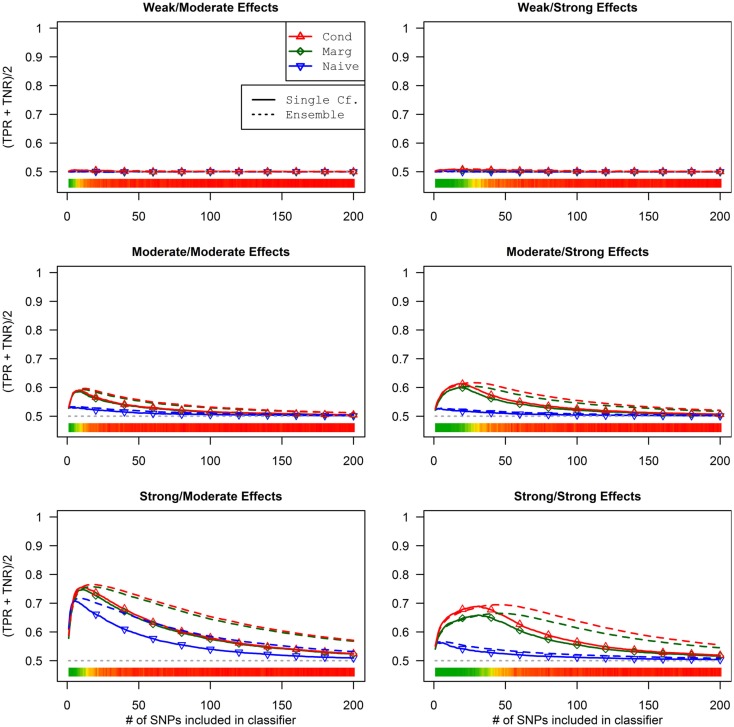
Figure 6.
Single-classifier and ensemble-of-classifier Da prediction using three prediction methods, with both single-classifier and ensembles, by SNP set size (Simulation Set 2). See legend for Figure 3. Due to the uneven distribution of Da, total accuracy is not a useful measure of prediction. Therefore, the average of the true positive rate (sensitivity) and true negative rate (specificity) was used. Note that this is a simple linear transformation of the Youden’s J statistic, used to make it comparable to the simple accuracy statistic used in simulation set 2.

