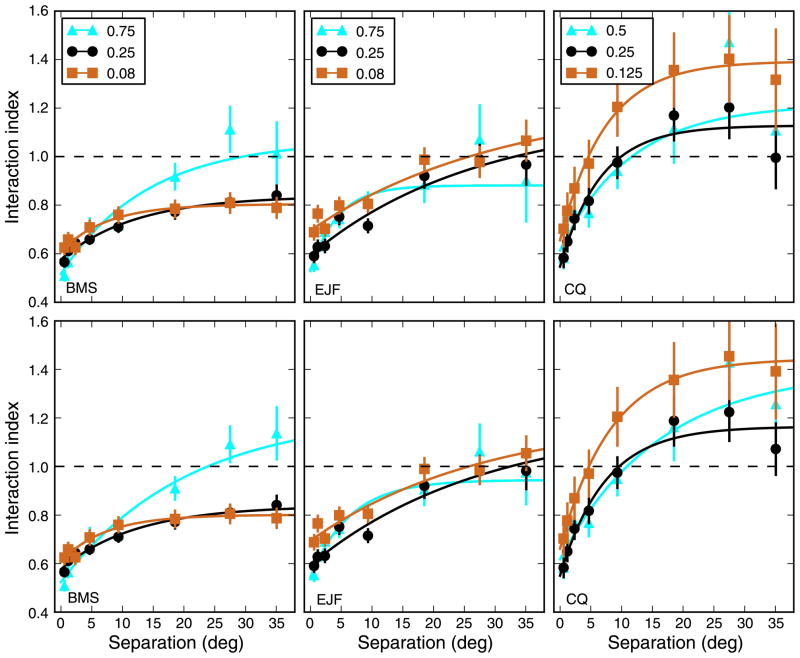
Figure 5.
Interaction index as a function of strip separation and SF. When two strips were presented, the OFR was generally different than either the response to a single strip or the sum of the responses to the individual strips. When the two strips were close together, they interacted in a strong suppressive manner, so that the response to the strips was only somewhat larger than the response to a single strip. However, when the separation increased the response to the pair became relatively stronger. In some conditions, and in some subjects more than in others, at large separation there was facilitation, so that the response to the pair was larger than the sum of the responses to the individual strips. Top row: Interaction index calculated using stimulus-based measures. Bottom row: Interaction index calculated using pair-based measures. This was potentially important for eccentric stimuli, when the latency of the response could be quite different from that for more central stimuli (Figure 1). However, the differences are modest. Note that in a majority of the cases the last point was lower than the next-to-last one. However, this effect was not significant, neither at the level of individual points (bootstrap difference test, p > 0.24) nor as a trend (bootstrap group difference test, p > 0.15). Error bars indicate ±SEM. Dashed line indicates linear summation. The data were fit using an exponential function with three parameters: II = II0 + G (1 − e−sep/σ).

