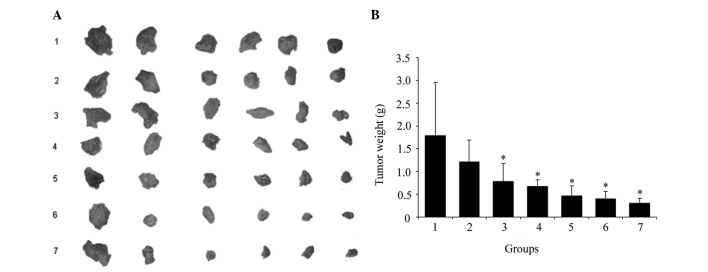
Figure 3.
The suppression effects of B. longum-pBV22210-IL-2 on H22 cell tumor growth. There were six mice in each group. The tumor weight was measured for each mouse. (A) Tumors excised from different groups. (B) The average tumor weight of different groups. Numbers 1–7 in the X axis correspond to the dextrose-saline solution group, wild-type B. longum group, B. longum-pBV22210-IL-2 group, CTX (30 mg/kg) group, B. longum-pBV22210-IL-2 plus B. longum-pBV22210-TRAIL group, B. longum-pBV22210-IL-2 plus B. longum-pBV22210-endostatin group and B. longum-pBV22210-IL-2 plus CTX (30 mg/kg) group, respectively. *P<0.05 versus dextrose-saline solution group. IL-2, interleukin-2; CTX, cyclophosphamide.

