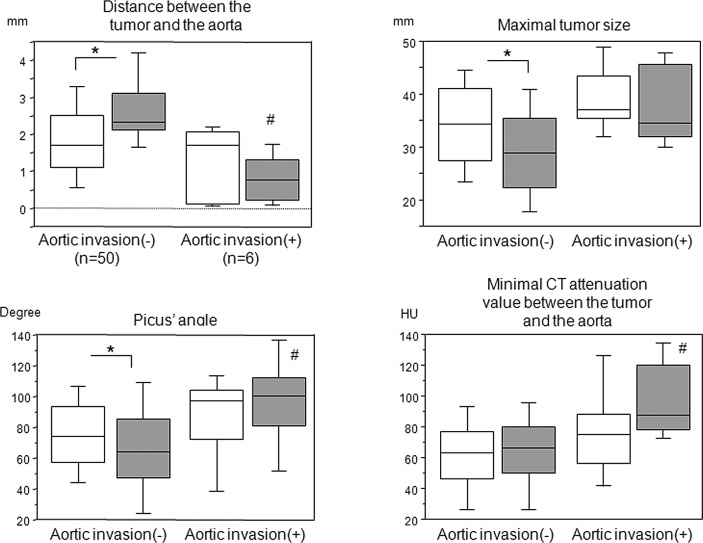
Figure 3.
Tumor-to-aorta distance, minimum CT attenuation value between the tumor and aorta, Picus’ angle and maximum tumor size in patients with or without aortic invasion. Open square, prior to the induction therapy; Gray-filled square, following the induction therapy. *p<0.05 calculated by the Wilcoxon signed rank test. #p<0.05 vs. without aortic invasion following induction therapy, calculated by the Mann-Whitney U test. CT, computed tomography.

