
Figure 1.
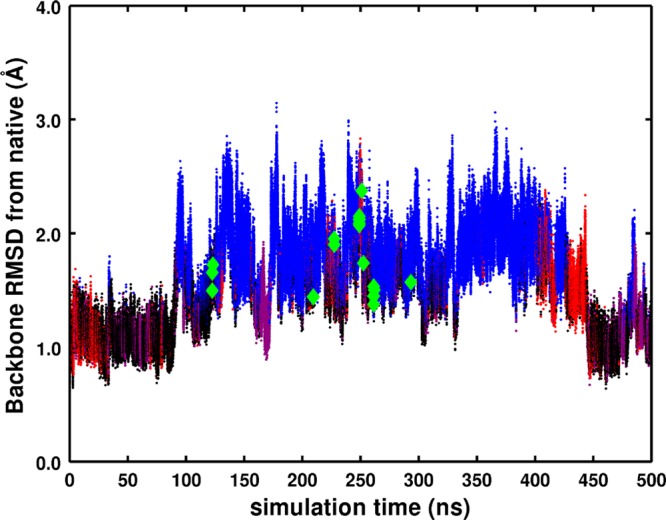
RMSD of the aMD trajectory from the crystal structure. Red, blue, green, purple, and black colors correspond to the kinetic clusters identified in the 1 ms cMD BPTI simulation.34 For each frame, we identify what cluster we are closest to and color it accordingly. Only a handful of transitions to the green state were observed, and we highlight them with diamond markers.