
Figure 5.
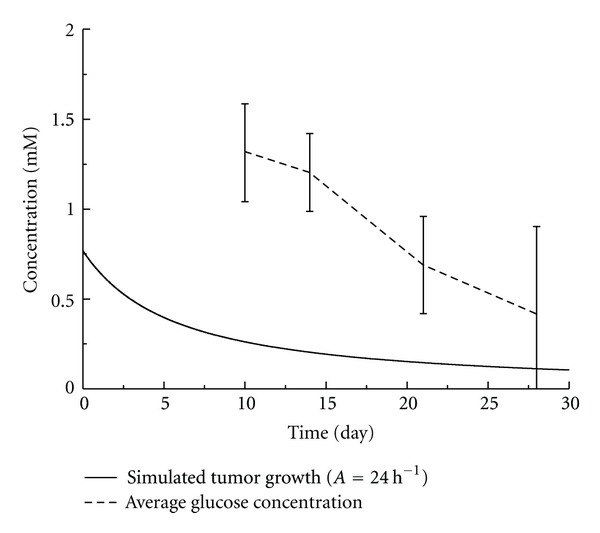
Average glucose concentration of the experimental measurement versus the numerical simulation of the treatment group.
Official websites use .gov
A
.gov website belongs to an official
government organization in the United States.
Secure .gov websites use HTTPS
A lock (
) or https:// means you've safely
connected to the .gov website. Share sensitive
information only on official, secure websites.
Average glucose concentration of the experimental measurement versus the numerical simulation of the treatment group.