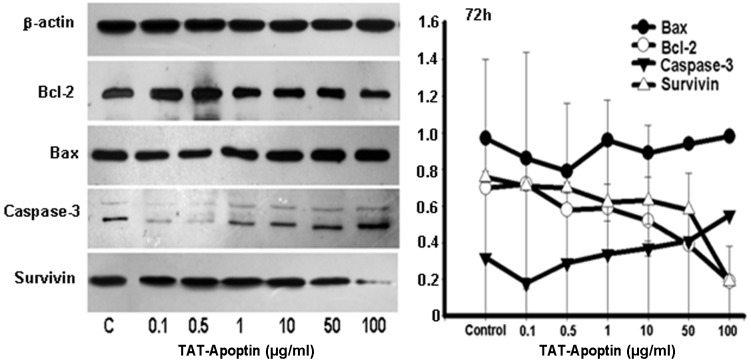
Figure 6.
Expression levels of Bax, Bcl-2, Caspase-3 and Survivin proteins and the gray values of those proteins detected by western blot analysis. Bax, Bcl-2, Caspase-3 and Survivin protein expression analysis following treatment of EJ cells with TAT-Apoptin (0.1, 0.5, 1, 10, 50 and 100 μg/ml) for 72 h. The protein expression level of Bcl-2 (F=194.736, P=0.000) and Survivin (F=27.545, P=0.000) in the EJ cells decreased significantly, while that of Bax (F=39.569, P=0.000) and Caspase-3 (F=81.303, P=0.000) increased significantly with increasing concentration of TAT-Apoptin.

