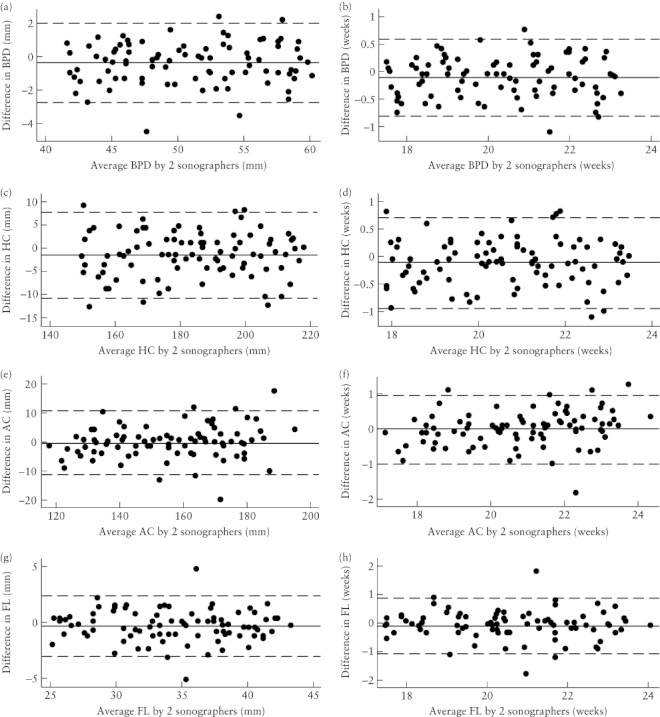
Figure 4.

Bland–Altman plots of the interobserver differences in the measurement of biparietal diameter (BPD) (a,b), head circumference (HC) (c,d), abdominal circumference (AC) (e,f) and femur length (FL) (g,h) at 18–24 weeks' gestation, expressed as the measurement itself (a,c,e,g) and the corresponding estimated gestational age (b,d,f,h). For each graph, the solid line represents the mean difference and the dashed lines are the mean difference ± 2 SD (see Table 3).
