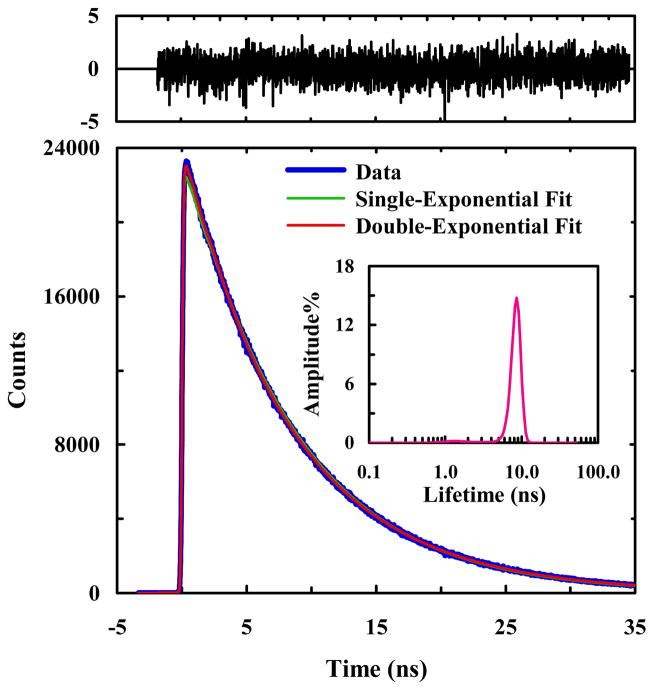
Figure 3.
A representative PheCN fluorescence decay curve of HP35-AP-W64A in 20 mM phosphate buffer (pH 7), as well as a single-exponential and a double-exponential fits to the data, as indicated. The double-exponential fit yielded the following time constants (relative amplitude): τ1 = 3.3 ns (9.2%) and τ2 = 8.7 ns (90.8%). Shown in upper panel are the weighted residuals of the double-exponential fit. Also shown in the inset is the lifetime distribution obtained from maximum entropy analysis.

