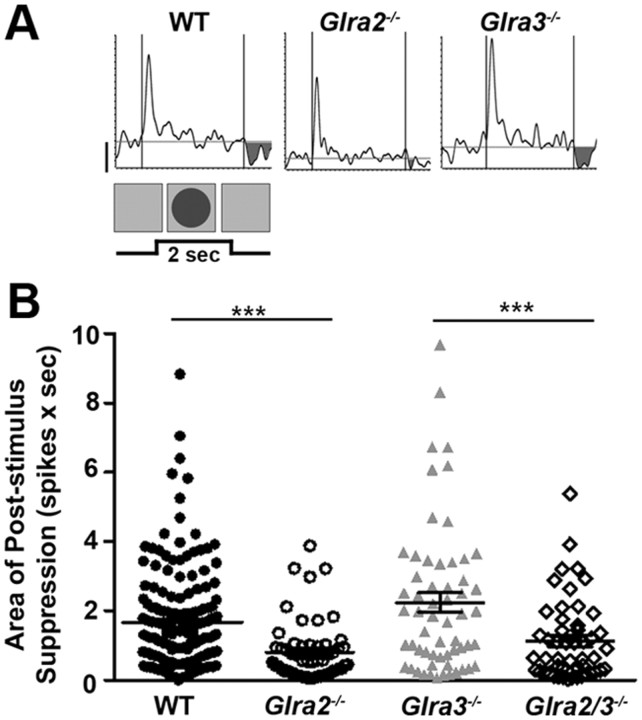
Figure 9.
Only GlyRα2-mediated inhibition modulates poststimulus suppression in OFF GCs. A, Representative PSTH responses of WT and single KO OFF GCs during receptive field center stimulation with a dark (3 cd/m2) spot. The shaded regions represent poststimulus suppression at the offset of the stimulus (background, 20 cd/m2). B, A scatter plot shows the distribution of the area of poststimulus suppression (spikes × sec) across genotype, which is lower in Glra2−/− (open circles; n = 56) compared to WT OFF GCs (closed circles; n = 168) but similar in Glra3−/− OFF GCs (gray triangles; n = 59). The area of poststimulus suppression in Glra2/3−/− OFF GCs (open diamonds; n = 50) is lower than in Glra3−/− OFF GCs but similar to that in Glra2−/− OFF GCs. Scale bar, 20 spikes per second. ***p < 0.001.

