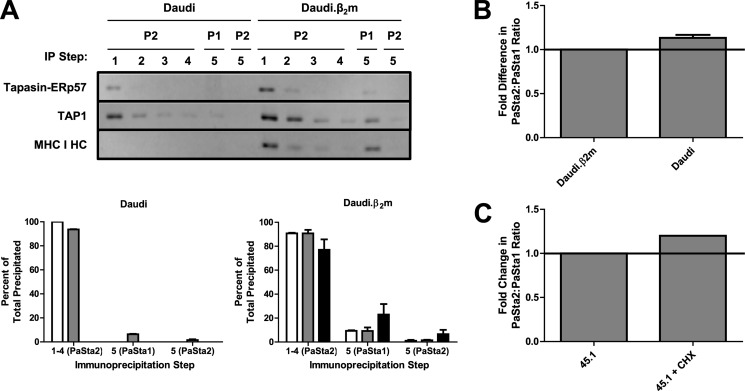
FIGURE 3.
Discrepancy in PaSta1 and PaSta2 binding is MHC I-dependent and detergent-independent. A, Daudi (left) and Daudi.β2m (right) digitonin lysates sequentially immunoprecipitated with PaSta2, followed by a fifth immunoprecipitation with PaSta1 or PaSta2. After SDS-PAGE and immunoblotting with R.Gp48C (anti-tapasin), R.RING4C (anti-TAP1), and 3B10.7 (anti-MHC I HC) (top), the bands were quantitated (bottom). These results are expressed as the means plus the S.D. of two independent experiments. White bars, tapasin-ERp57. Gray bars, TAP1. Black bars, MHC I HC. Daudi and Daudi.β2m cells (B) or untreated and CHX-treated (10 μg/ml for 2.5 h) 45.1 cells (C) were fixed in formaldehyde, permeabilized in saponin, and labeled with PaSta1 or PaSta2 and AlexaFluor488-coupled goat anti-mouse IgG prior to intracellular flow cytometry analysis. A negative control, labeled only with secondary antibody, was also included. The ratio of PaSta2/PaSta1 binding following background subtraction was then calculated. These results are expressed as the means plus the S.D. of three (B) or two (C) independent experiments. In representative experiments, the ratio of the mean PaSta2 fluorescence to the mean PaSta1 fluorescence before normalization was 1.01 for Daudi.β2m cells and 1.23 for Daudi cells (B) and 0.87 for untreated 45.1 cells and 1.01 for CHX-treated 45.1 cells (C). P1, PaSta1. P2, PaSta2. IP, immunoprecipitation. HC, heavy chain.

