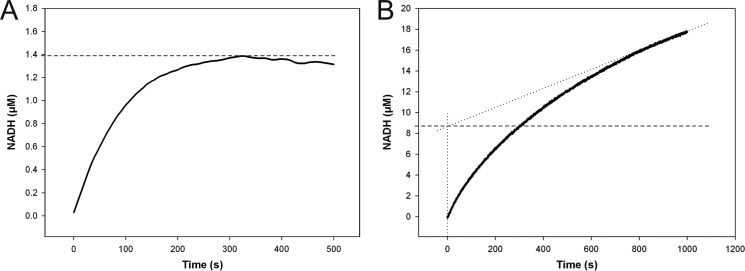
FIGURE 4.
Stopped-flow progress curves of NADH formation in reactions catalyzed by wild-type hUXS1 (A) and E120A mutant (B). Reactions were performed using 0.5 mm NAD+ and 10 mm UDP-GlcUA. A, reaction with 25 μm wild-type enzyme. There was no accumulation of NADH above 0.055 mol enzyme equivalents (1.4 μm; dashed line). B, the E120A mutant (15 μm) accumulated up to 0.58 mol enzyme equivalents (8.7 μm; dashed line) of NADH in the pre-steady state, indicating a shift in the rate-determining step from NADH formation to NADH consumption.

