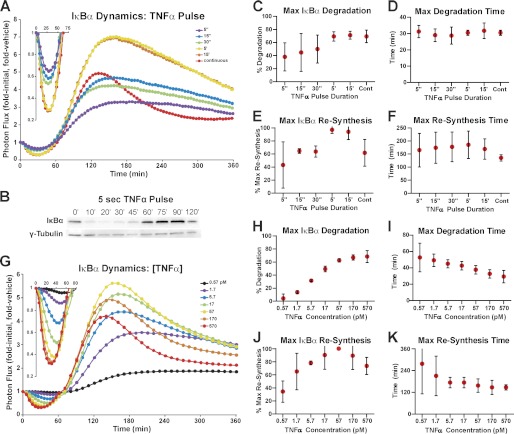
FIGURE 2.
ΙκBα dynamics as a function of TNFα pulse duration and concentration. A, HepG2 cells transiently expressing κB5→ΙκBα-FLuc were pulsed with a saturating concentration of TNFα (1.2 nm; 20 ng/ml) or vehicle for the indicated durations with data acquisition over a period of 360 min. Data were normalized as fold initial and fold vehicle (cells pulsed with vehicle for the same duration) and represent the mean of four independent TNFα exposure experiments, each performed in duplicate and averaged. B, HepG2 cells were stimulated with a 5-s pulse of TNFα (1.2 nm; 20 ng/ml), and lysates were collected to capture ΙκBα degradation and resynthesis. Lysates were resolved together on a 4–15% gradient gel and blotted for endogenous ΙκBα and γ-tubulin (loading control). C and D, plots representing the extent of maximal ΙκBα degradation (C), and the time at which maximal ΙκBα degradation occurred (D), as functions of TNFα pulse duration. E and F, plots representing the extent of maximal ΙκBα resynthesis (expressed as a percentage of the maximum level of resynthesis achieved in a given experiment) (E), and the time at which maximal ΙκBα resynthesis occurred (F), as functions of TNFα pulse duration. G, HepG2 cells expressing κB5→ΙκBα-FLuc were continuously treated with TNFα or vehicle at the indicated concentrations, and bioluminescent data were acquired for 360 min. Data were normalized as before and represent three independent experiments, performed in triplicate and averaged. H and I, plots representing the extent of maximal ΙκBα degradation (H), and the time at which maximal ΙκBα degradation occurred (I), as functions of TNFα concentration. J and K, plots representing the extent of maximal ΙκBα resynthesis (J), and the time at which maximal ΙκBα resynthesis occurred (K), as functions of TNFα concentration. Error bars represent 95% confidence interval of the mean. See also supplemental Fig. S3.

