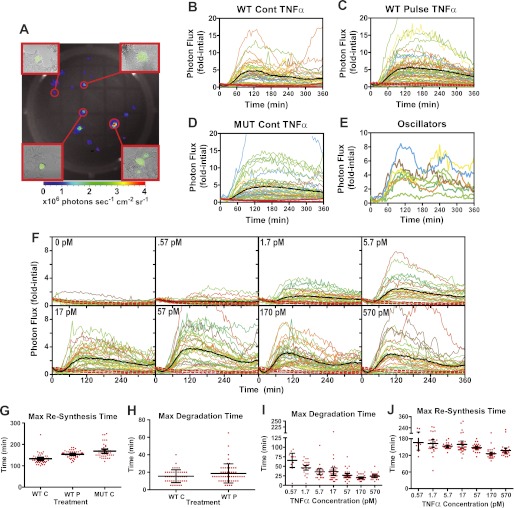
FIGURE 3.
Characterization of ΙκBα dynamics in single cells. A, image of a single well of a 24-well plate with bioluminescent foci representing sparsely plated HepG2 cells transiently expressing the FUW-FLG luciferase-enhanced GFP fusion reporter. Insets represent 10× fluorescent micrographs of the indicated bioluminescent foci, demonstrating that most foci represent a single transfected cell and occasionally a small group of 2–3 cells. B–E, single HepG2 cells transiently expressing κB5→ΙκBα-FLuc (B and C) or κB5→ΙκBα(S32A,S36A)-Fluc (D) were given continuous (Cont) (B and D) or a 30-s pulse (C) of TNFα (1.2 nm; 20 ng/ml). Data were normalized as fold initial, and data from two independent experiments are plotted together. Black lines represent the experimental mean and red dashed lines represent the 95% confidence interval of the vehicle-treated controls. Mut, mutant. E, select examples of ΙκBα-FLuc oscillations observed in a minor subset of the cells from B. F, single HepG2 cells transiently expressing κB5→ΙκBα-FLuc were continuously treated with TNFα or vehicle at the indicated concentrations. G–J, scatter plots representing the times of maximal ΙκBα-FLuc resynthesis (G) and degradation (H) calculated after smoothing data in B–D, and the times of maximal ΙκBα-FLuc degradation (I) and resynthesis (J) calculated after smoothing data in F. Error bars represent 95% confidence interval of the mean. See also supplemental Fig. S1.

