FIGURE 5.
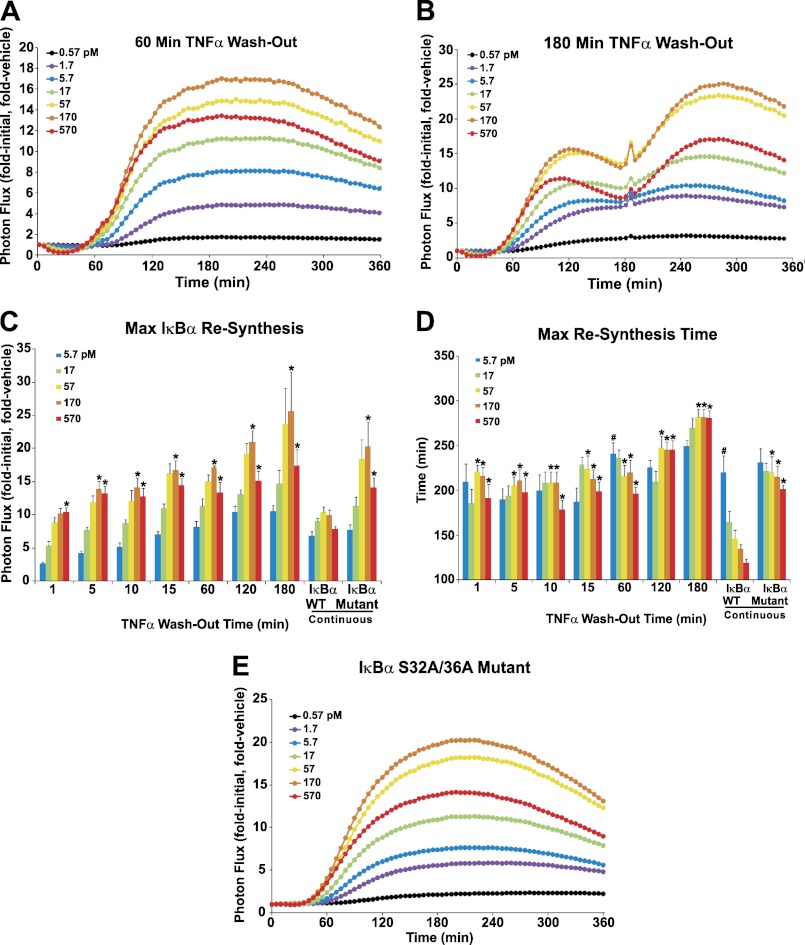
Experimental investigation of complex ΙκBα resynthesis patterns. A and B, HepG2 cells expressing κB5→ΙκBα-FLuc were treated with the indicated TNFα concentrations or vehicle at t = 0 min. At 60 or 180 min, the cells were washed and replenished with fresh TNFα-free media (washout conditions) or media containing TNFα at the initial concentration (a mock washout). Data were acquired every 5 min for 360 min and normalized as before to represent the mean of three or four independent TNFα exposure experiments, each performed in triplicate and averaged. C, plot representing the effect of washout time and TNFα concentration (5.7 pm or higher) on maximum ΙκBα resynthesis magnitude. All 180 min data represent parameters calculated from the second ΙκBα resynthesis peak. Data are mean ± S.E. * indicates p < 0.05 for TNFα (170 or 570 pm) washout or mutant ΙκBα(S32A,S36A)-FLuc versus continuous TNFα wild-type ΙκBα-FLuc. The 30-min data were n = 2 and thus were excluded from statistical analysis. D, plot representing the effect of washout time and TNFα concentration on the timing of maximum ΙκBα resynthesis. # indicates p < 0.05 for lowest versus highest TNFα concentration within a given TNFα treatment. E, HepG2 cells expressing mutant κB5→ΙκBα(S32A,S36A)-FLuc were treated continuously with TNFα or vehicle at the indicated concentrations; data were normalized as described previously and represent three independent experiments, each performed in triplicate and averaged. See also supplemental Figs. S2 and S3.

