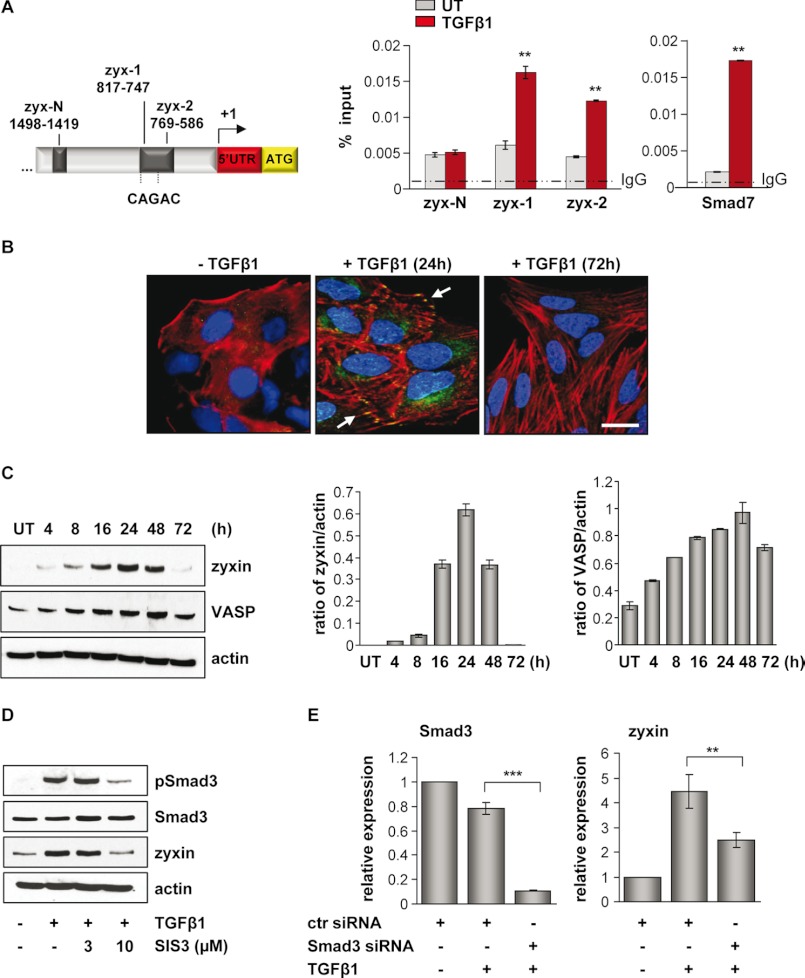
FIGURE 1.
Zyxin is a direct target of TGF-β/Smad3-dependent signaling. A, schematic presentation of the zyxin promoter area. Positions of potential Smad3 binding are indicated relative to the transcription start site. Arrow indicates the transcription start site. ChIP analysis revealed Smad3 binding to the zyxin promoter region after 30 min of TGF-β1 stimulation, as analyzed by the qRT-PCR method (zyx-1 and zyx-2 represent two different primer sets in zyxin promoter region). The ChIP-qRT-PCR primers amplifying a fragment of Smad7 promoter were used as a positive control. Gray bars indicate Smad3 base-line binding to the zyxin promoter in the untreated (UT) condition, whereas red bars indicate Smad3 binding after TGF-β1 stimulation. Data are presented as mean ± S.D. **, p < 0.01. B, A549 cells were either untreated or treated with TGF-β1, fixed, and immunostained with anti-zyxin antibody (green). Actin cytoskeleton was visualized by Alexa Fluor 568 phalloidin staining (red), and nuclei were visualized with DAPI (blue). White arrows indicate zyxin localization. Scale bar: 10 μm. C, immunoblot analysis of zyxin and VASP in untreated or TGF-β1-treated A549 cells. Densitometric analysis was used to determine the zyxin/actin and VASP/actin ratios (ImageJ software). Data are shown as mean ± S.E. D, A549 cells were cultured in either the presence or the absence of SIS3 inhibitor and TGF-β1 for 24 h. Protein lysates were prepared and Western blotted using anti-phospho-Smad3, Smad3, or zyxin antibodies. β-Actin was used as a loading control. E, A549 cells were transfected with control (ctr) or Smad3 siRNA, serum-starved, and then incubated with or without TGF-β1 for 24 h. The mRNA levels of Smad3 and zyxin were quantified by qRT-PCR. Data are presented as mean ± S.D. of three independent experiments; **, p < 0.01, ***, p < 0.001.

