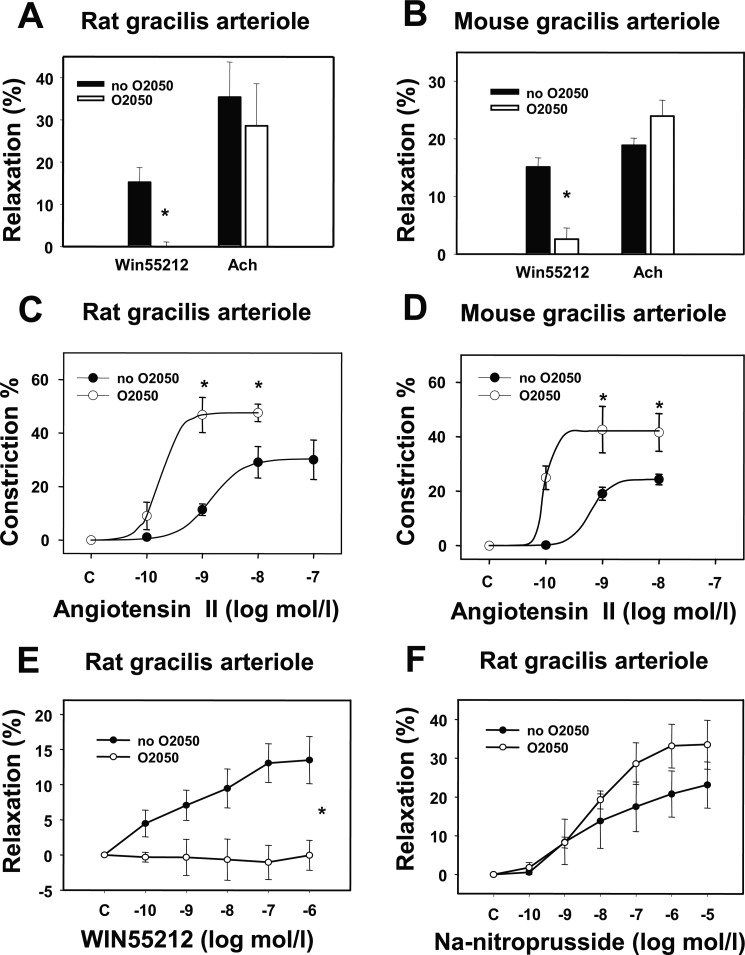
FIGURE 2.
Effects of CB1R inhibition on agonist-induced responses of gracilis arterioles. A and B, shown are the effects of the CB1R antagonist O2050 (1 μm) on the relaxations induced by the CB1R agonist WIN 55212 (1 μm) and by the endothelial relaxant Ach (10 μm) in rat gracilis arteriole segments (A, n = 4) and in mouse gracilis arteriole segments (B, n = 4). Values were calculated as percent change of diameter from control. Mean ± S.E. values are shown. The asterisk indicates significant change of agonist-induced tone in response to inhibitor treatment (p < 0.05). C and D, cumulative log-concentration-effect curves for Ang II were taken by pressure arteriography in rat (C, n = 5–6) and mouse (D, n = 4) gracilis arterioles. Effects of the CB1R antagonist O2050 (1 μm) are shown. E and F, shown are cumulative log-concentration-effect curves induced by WIN 55212 (0.1 nm–1 μm) and by sodium nitroprusside (0.1 nm--10 μm) in rat gracilis arterioles (n = 4–7). Effects of the CB1R antagonist O2050 (1 μm) are shown. Values were calculated as percent change of diameter from the incubated control. Mean ± S.E. values are shown. The asterisk indicates significant change of vasoconstrictor-induced contraction in response to inhibitor treatment (p < 0.05). Data obtained with curve fitting method showed that in rat gracilis arterioles Emax values were 30.3 ± 4.4 and 47.5 ± 4.5% (p < 0.05, n = 5–6) in the absence and in the presence of O2050, respectively. Log EC50 values were −8.8 ± 0.2 and −9.7 ± 0.29 in the absence and presence of O2050, respectively. In mouse arterioles Emax values were 24.3 ± 1.5 and 42.1 ± 6.1% in the absence and presence of O2050, respectively (p < 0.05, n = 4). Log EC50 values were −9.2 ± 0.2 and −10.0 ± 3.4 in the absence and presence of O2050. Changes in EC50 values were not significant.

