FIGURE 5.
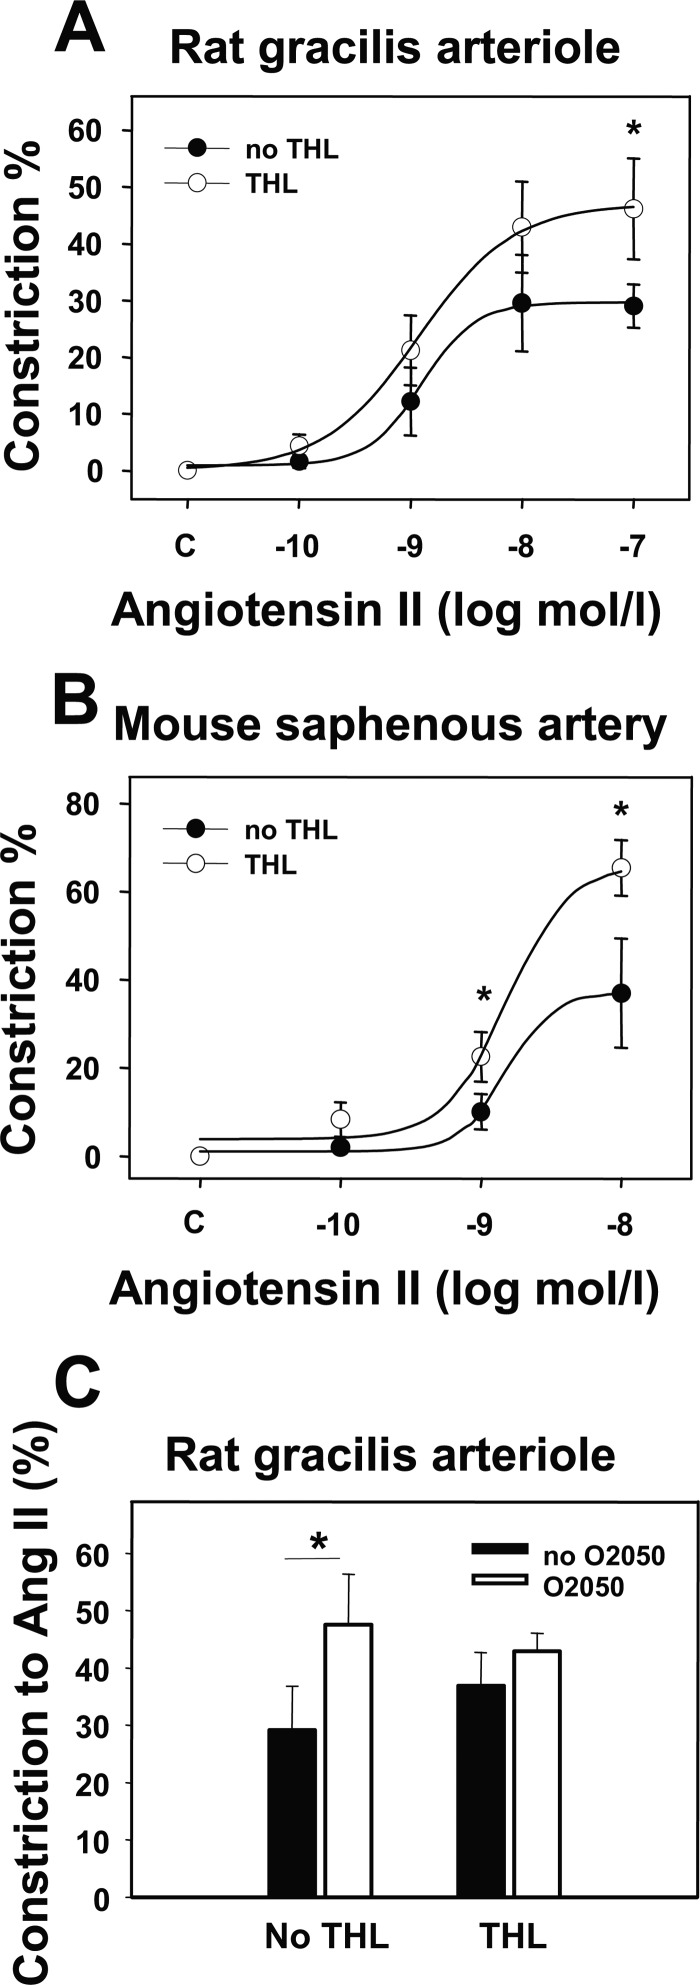
Effects of DAG lipase inhibition on Ang II-induced arteriolar tone. A and B, shown is the effect of the DAG lipase inhibitor THL (1 μm) on the Ang II-induced vasoconstriction in rat gracilis arterioles (A, n = 5–6) and on mouse saphenous arteries (B, n = 4–5), taken by pressure arteriography. Values were calculated as percent change of diameter compared with control. Mean ± S.E. values are shown. Asterisks indicate significant changes of vasoconstrictor-induced tone after inhibitor treatment (p < 0.05). C, shown is the effect of CB1R inhibitor (O2050, 1 μm) on the Ang II-induced (10 nm) vasoconstriction with and without THL pretreatment in rat gracilis arterioles (4–5 segments of each treatment). Mean ± S.E. values are shown. Asterisks indicate significant changes of the vasoconstrictor effect in the presence of the inhibitor (p < 0.05). Data obtained with the curve-fitting method showed that Emax values were 29.7 ± 4.9 and 47.0 ± 7.6% (p < 0.05, n = 5–6), and log EC50 values were −8.9 ± 0.2 and −8.9 ± 0.2 m in the absence and presence of THL, respectively. In mouse saphenous arteries Emax values were 37.1 ± 6.8 and 66.1 ± 5.1% (p < 0.05, n = 4–5), and log EC50 values were −8.8 ± 0.5 and −8.8 ± 0.2 m in the absence and presence of THL, respectively. Changes in EC50 values were not significant.

